- Pepe’s breakout targets resistance at $0.00002187, with bullish patterns indicating potential upside momentum.
- Technical indicators and liquidation data point to strong bullish sentiment, supporting a possible rally.
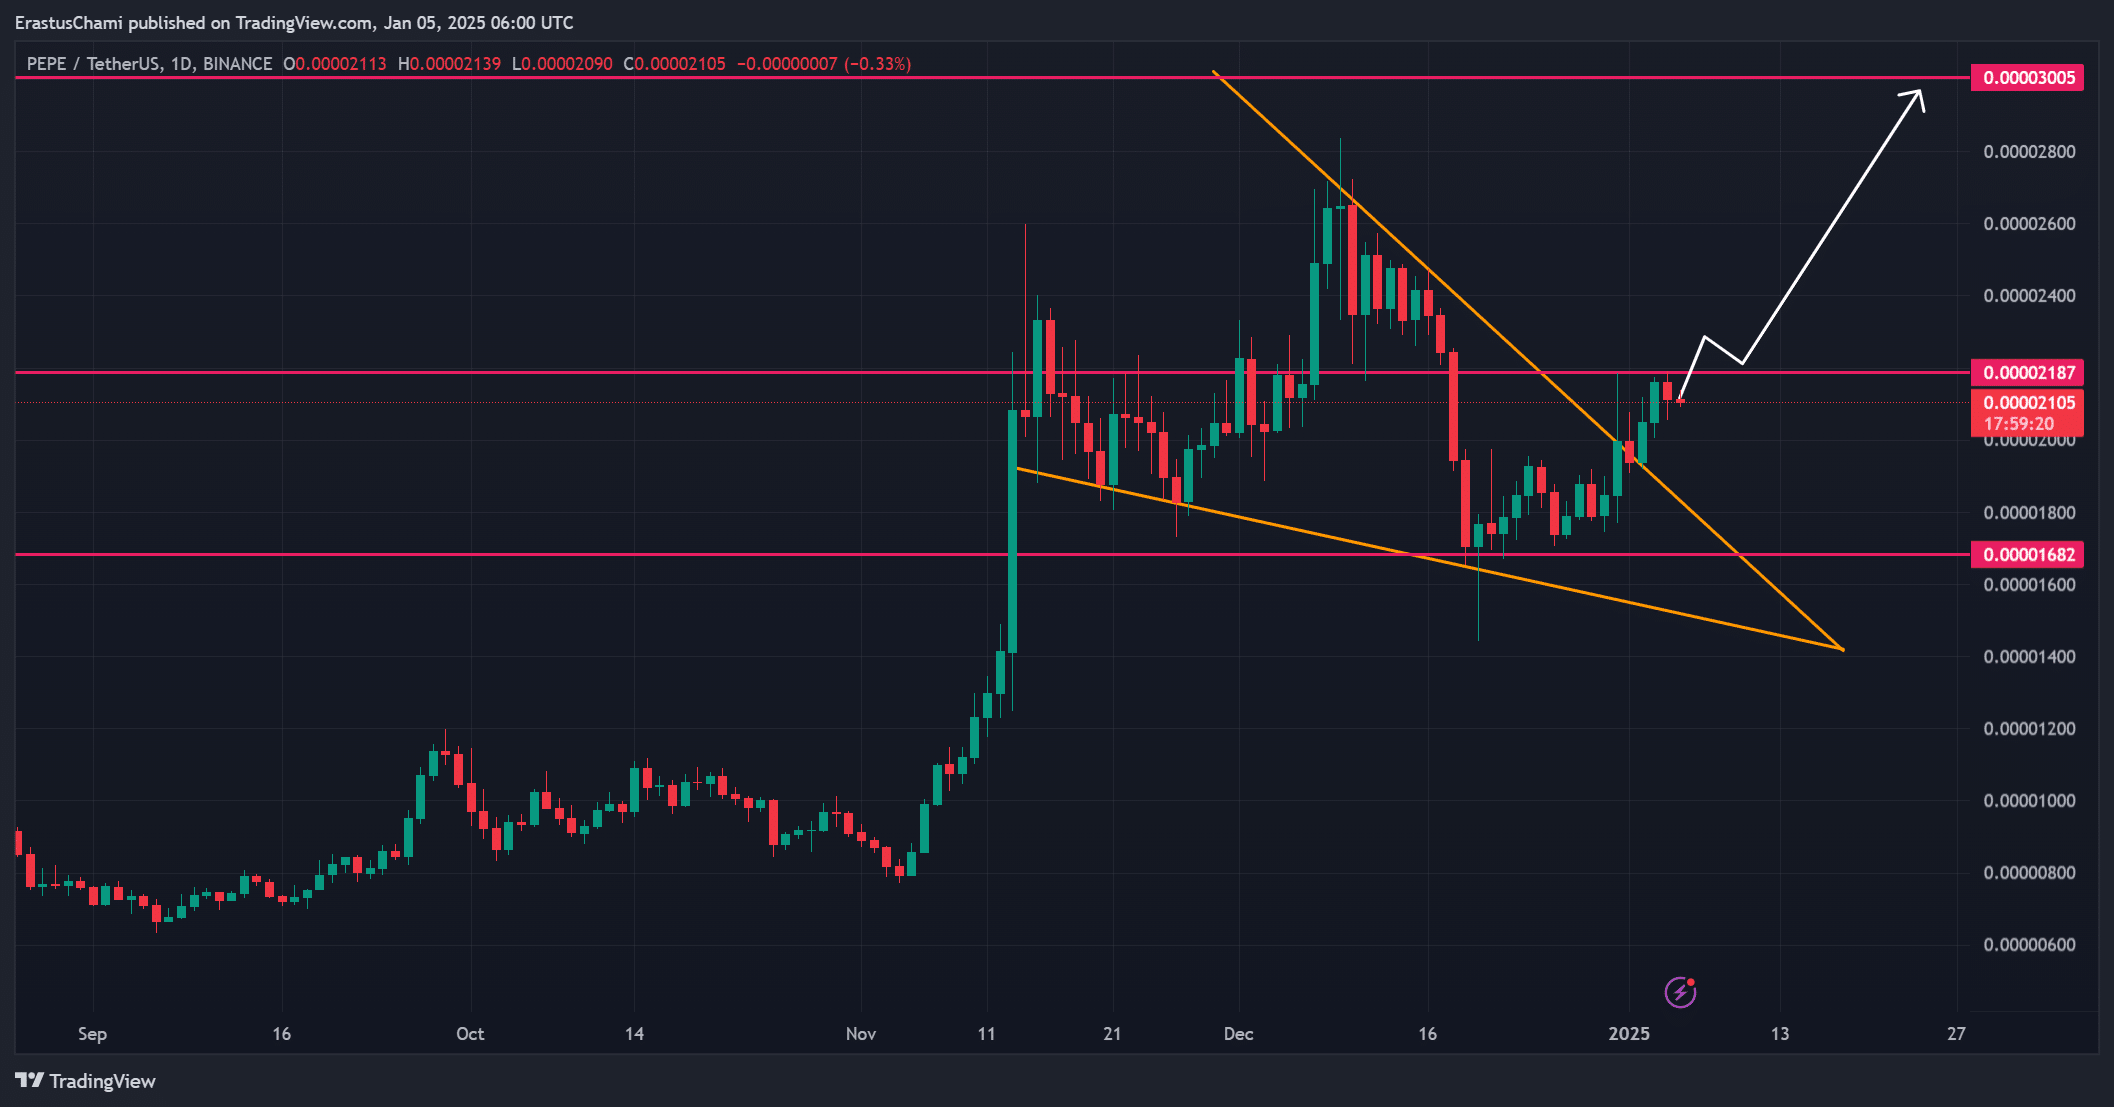
Pepe [PEPE] emerged from a descending symmetrical triangle, a technical pattern often associated with breakout potential in crypto markets.
The token was trading at $0.00002102, down 1.18% at the time of writing, showing signs of strength despite minor retracements.
The question now is whether Pepe can maintain his upward momentum and soar to new heights in the coming days.
PEPE’s price action shows potential
Pepe’s price action (PA) reflected a strong recovery as the token consolidated near critical resistance at $0.00002187.
A break above this level could confirm a bullish breakout, paving the way for a potential rally towards $0.000030, the next significant resistance.
Moreover, the breakout of the symmetrical triangle highlighted the reduced selling pressure and growing buyer interest.
However, failure to breach $0.00002187 could lead to a new consolidation phase, testing the support levels at $0.00001682.


Source: TradingView
The NVT ratio indicates growing market confidence
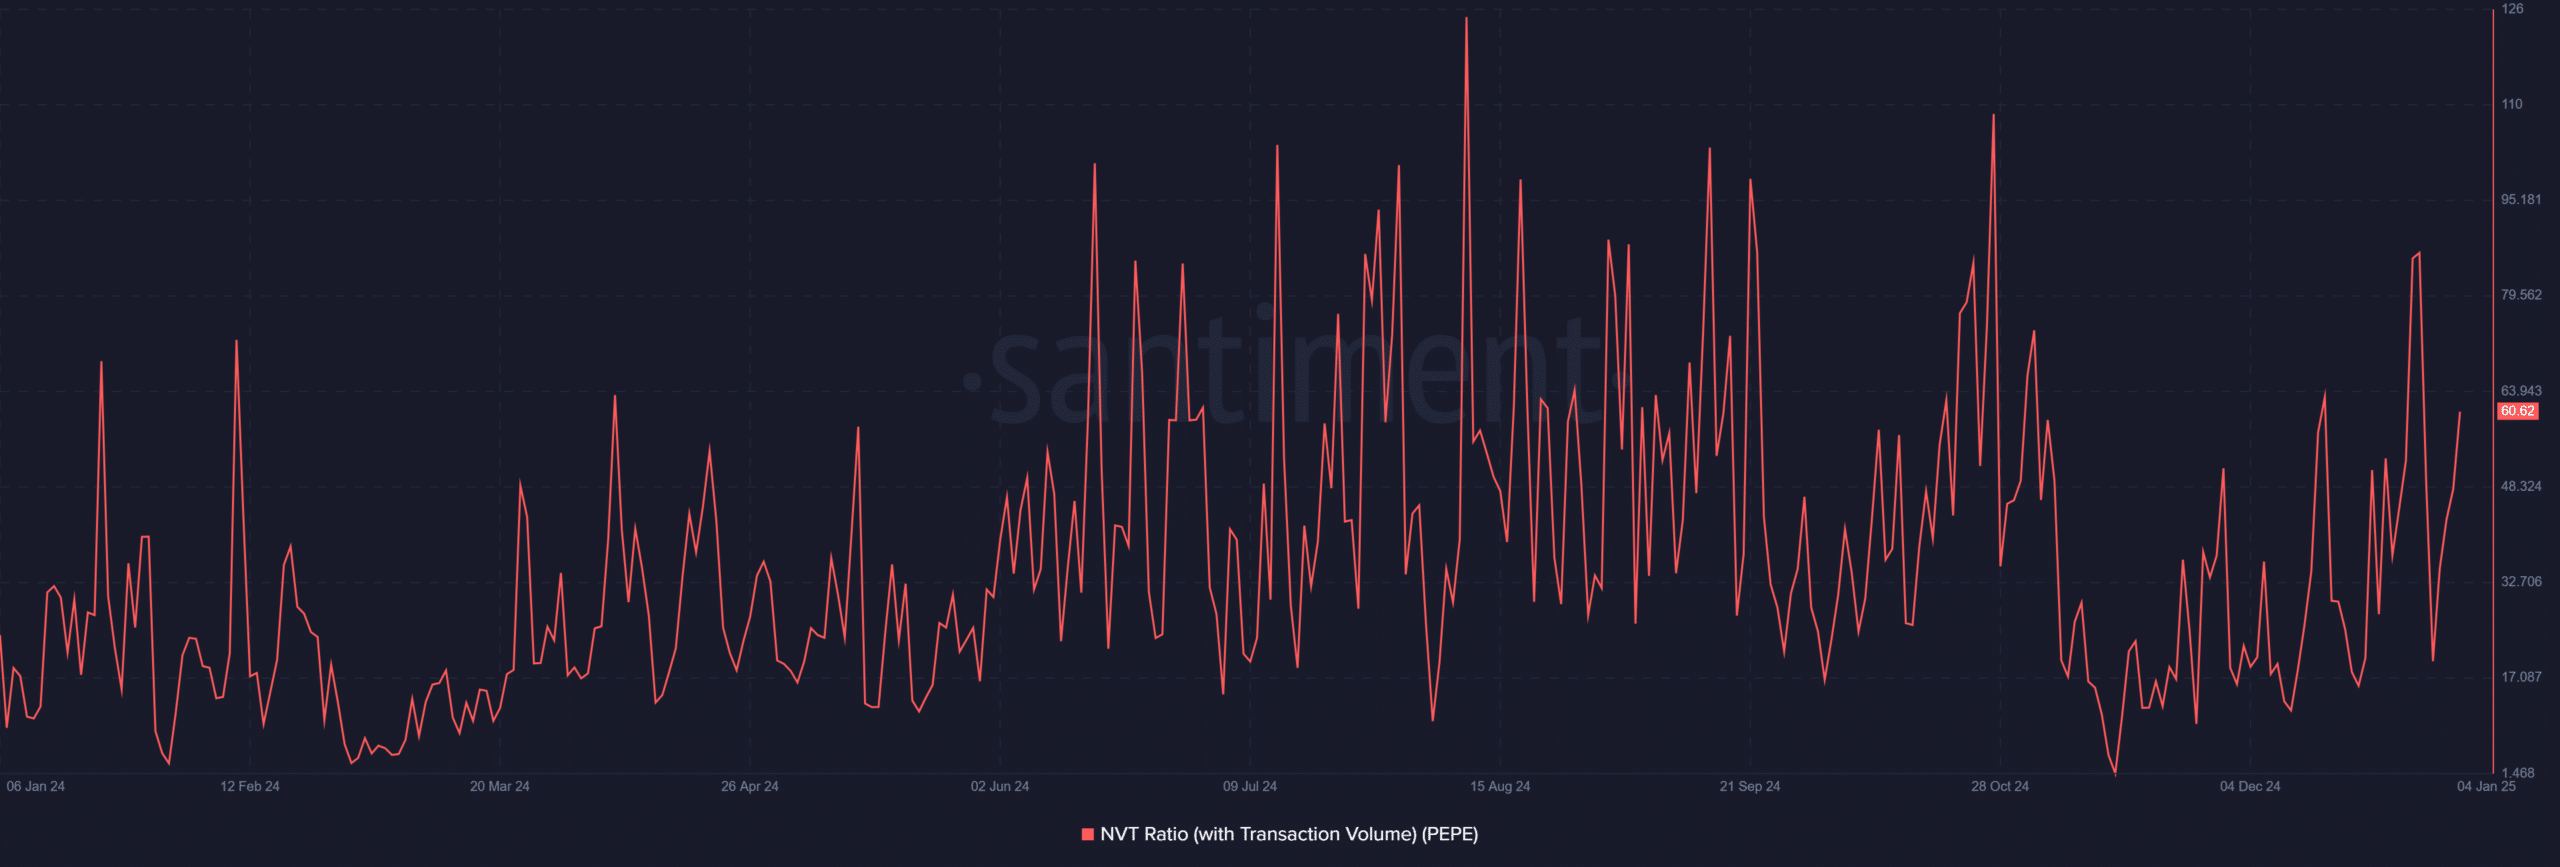
The network value to transaction (NVT) ratio has increased from 48 to 60.62, indicating increasing on-chain activity relative to the token’s market valuation.
This indicated renewed investor confidence as transaction activity supported the price recovery.
A higher NVT ratio often reflects continued interest in the asset, which could reinforce bullish sentiment. However, for the price to increase, the ratio must remain consistent with increasing transaction volumes.


Source: Santiment
PEPE daily active addresses show steady engagement
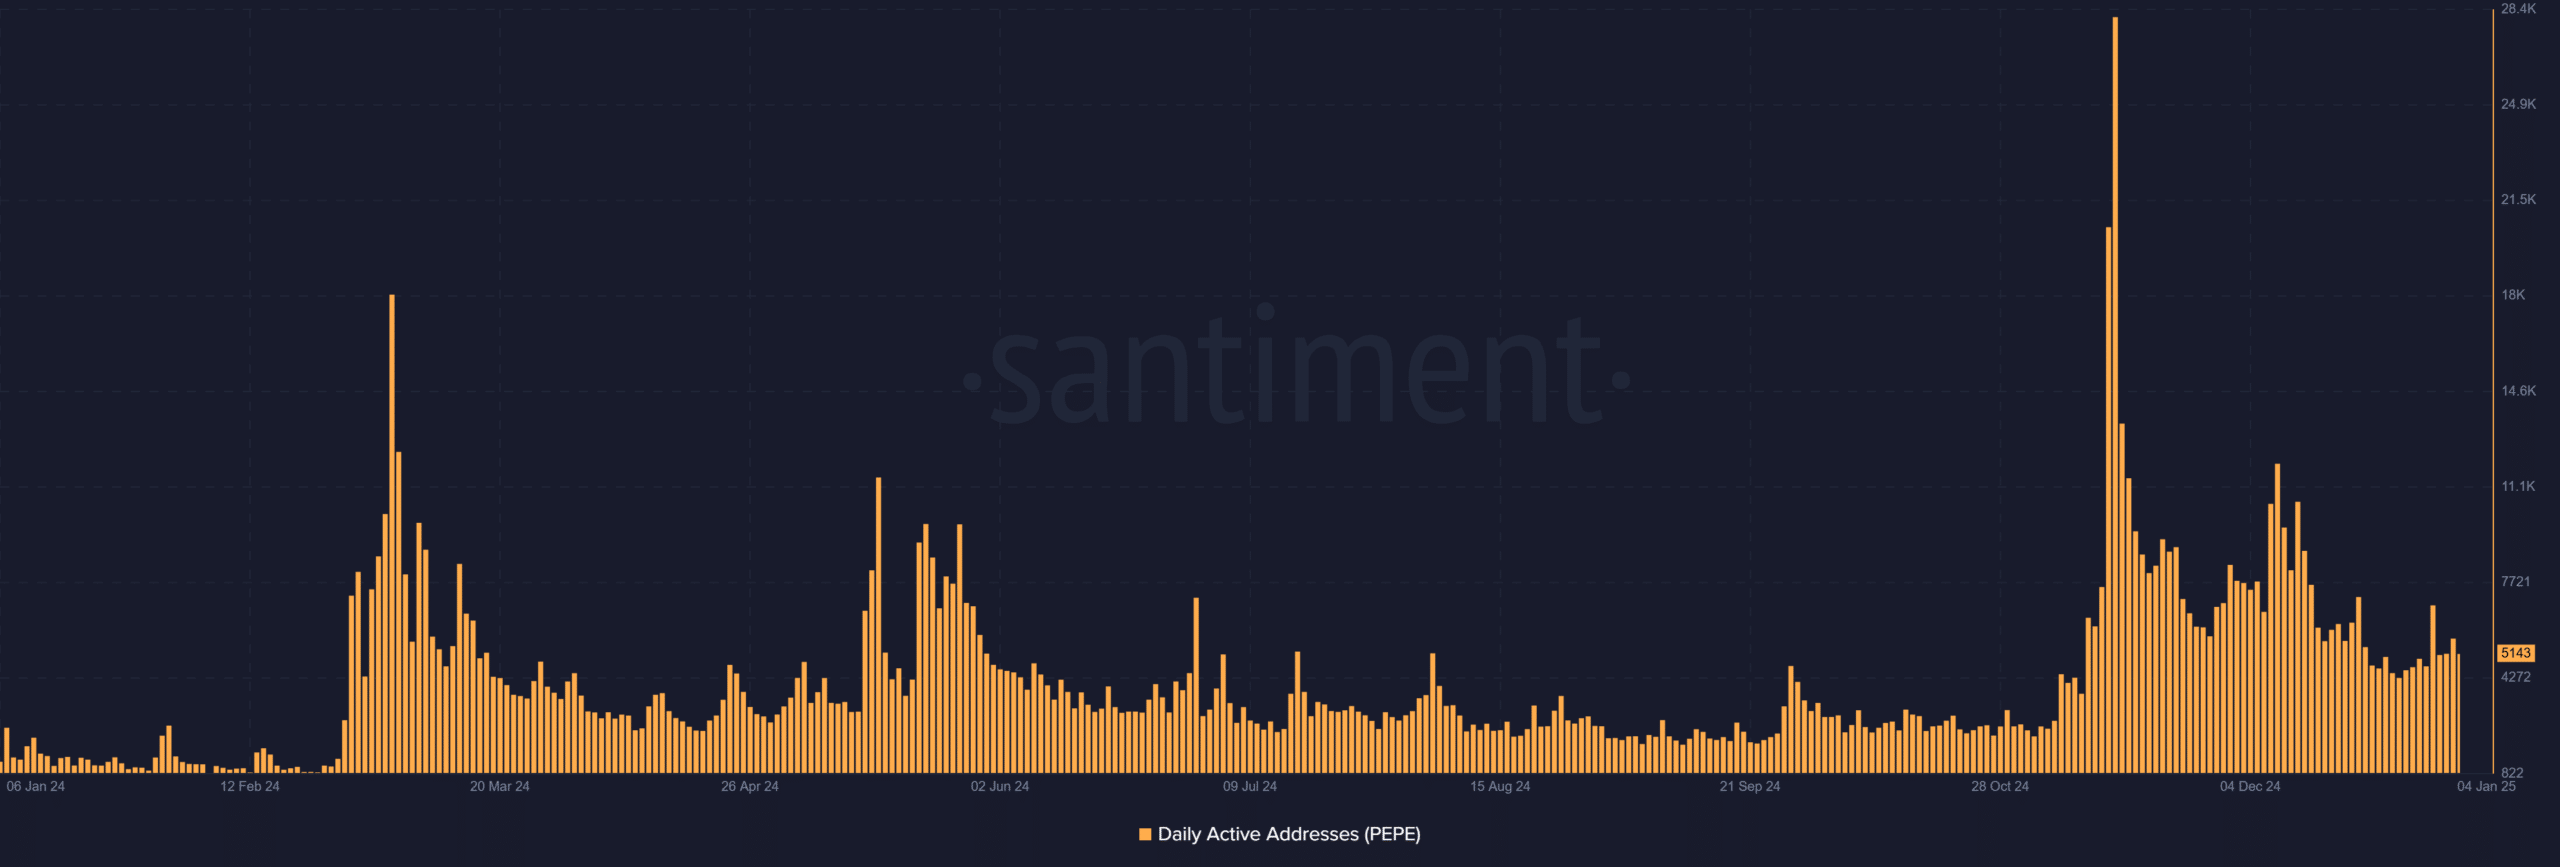
Daily active addresses were recorded at 5,143, reflecting moderate but steady user participation. This stability indicates that a dedicated user base is actively engaged with Pepe, even during periods of price consolidation.
If the token’s price continues to rise, an increase in the number of daily active addresses could further validate the breakout potential. Therefore, increased user activity in the coming days will be crucial to maintain the upward momentum.


Source: Santiment
Technical indicators support bullish momentum
Pepe’s technical indicators signaled a turning point in market dynamics.
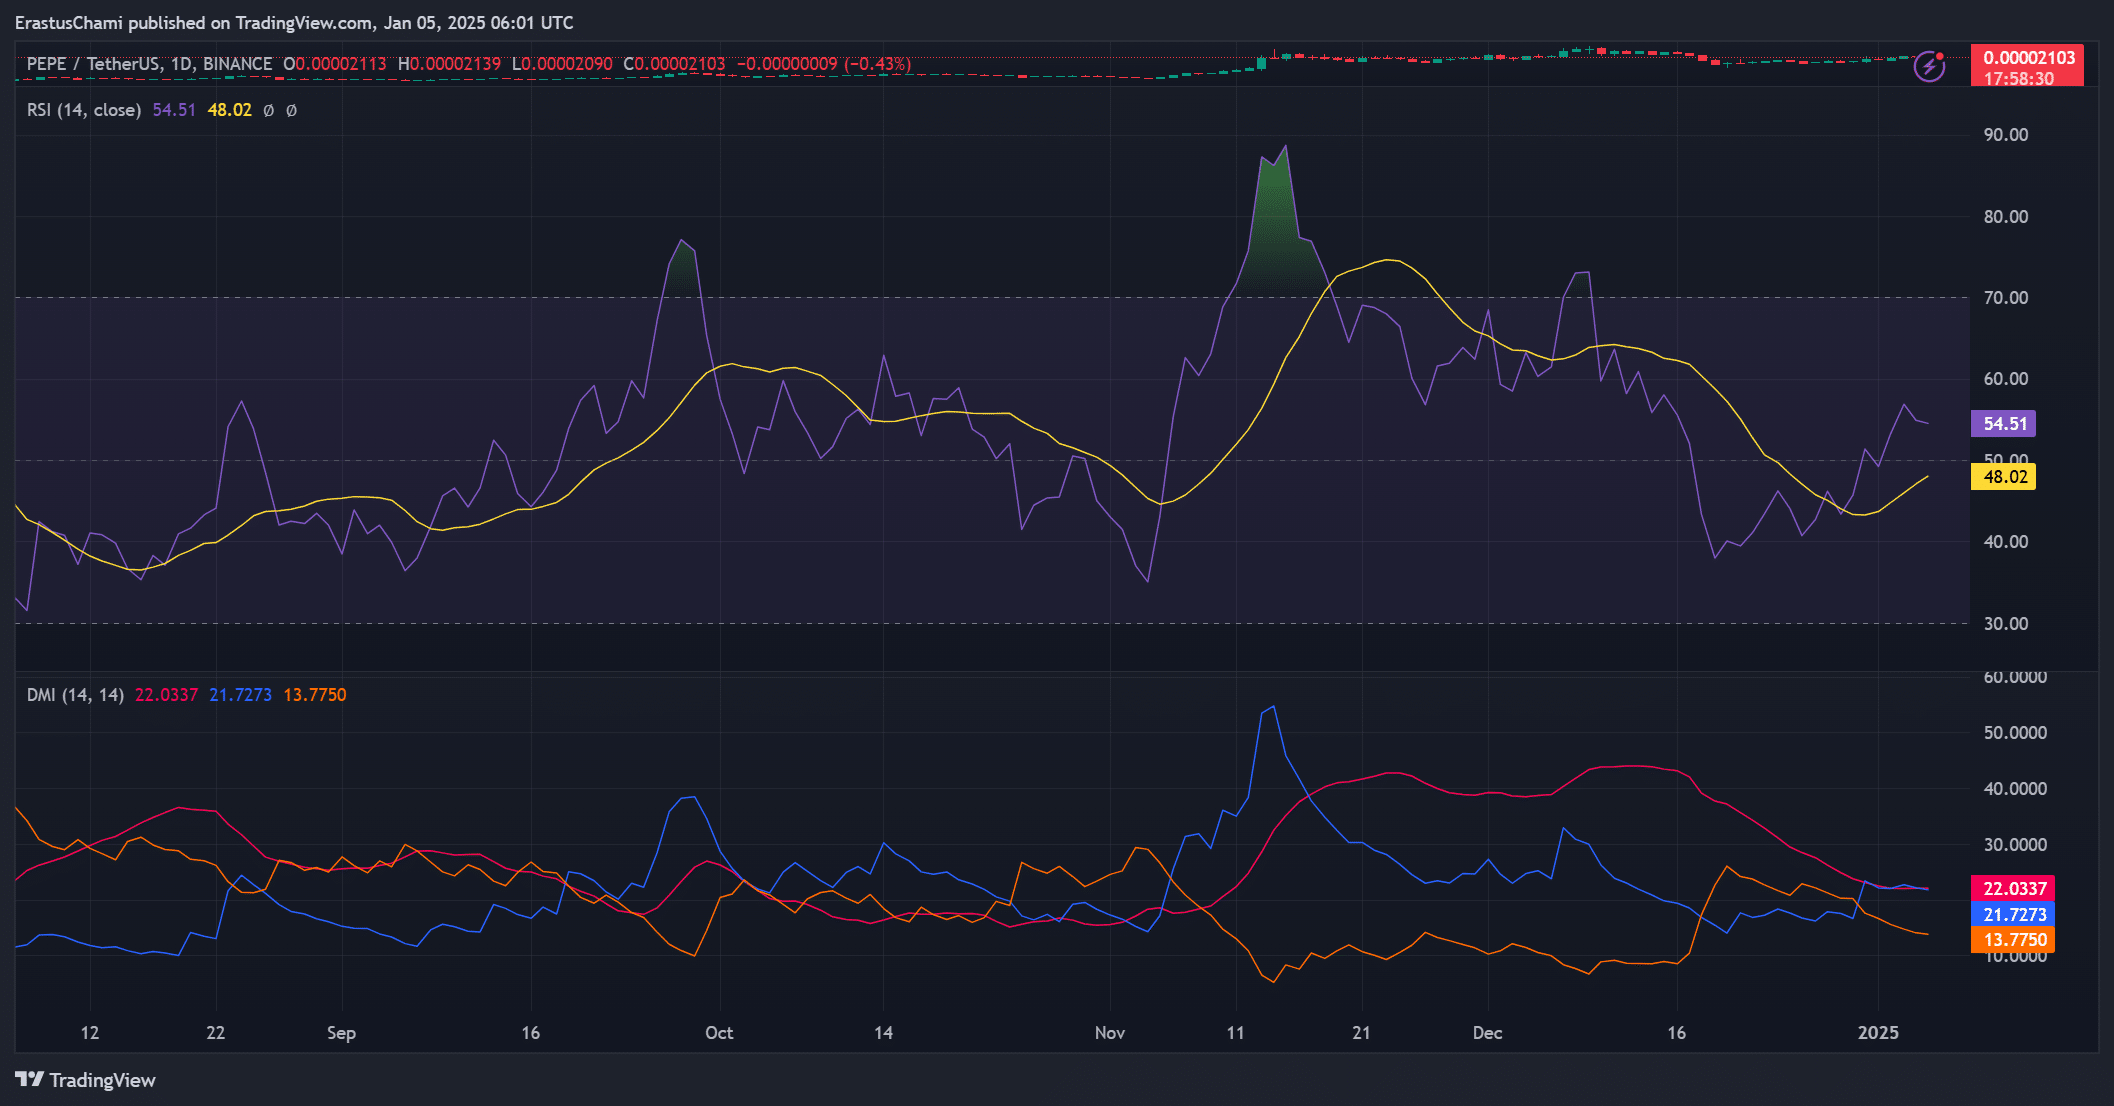
The relative strength index (RSI) stood at 54.51, indicating moderate bullish momentum and leaving room for further upside without overbought conditions.
Furthermore, the directional movement index (DMI) revealed that the +DI was 21.7, -DI was 13, and the average directional index (ADX) was 22.
These figures indicated a strengthening trend, with buyers gaining control of the market. However, for the rally to materialize, the ADX must continue to rise to confirm trend strength.


Source: TradingView
Liquidation data indicates bullish sentiment
Liquidation data shows that $269.41K of short positions have been wiped out, compared to $35.47K of long positions, reflecting growing confidence in an upward move.
This bullish bias among traders provides additional support for a possible breakout. However, continued buying pressure will be necessary to maintain these gains and prevent a price decline.


Source: Coinglass
Read Pepe’s [PEPE] Price forecast 2025–2026
Conclusion: PEPE is ready to test new highs
Pepe’s breakout from the descending symmetrical triangle, coupled with improving on-chain metrics and bullish technical indicators, positions it for a potential rally.
If the token can surpass the resistance at USD 0.00002187, it could pave the way for a move towards USD 0.000030. Therefore, Pepe appears poised for upside momentum, provided market conditions remain supportive in the near term.

