
 is targeting $7.20 after forming a bullish ascending triangle")
- Optimism could rise 340% as it approaches a breakout from a bullish ascending triangle.
- On-chain data showed growing adoption and reduced foreign exchange inflows, fueling bullish momentum.
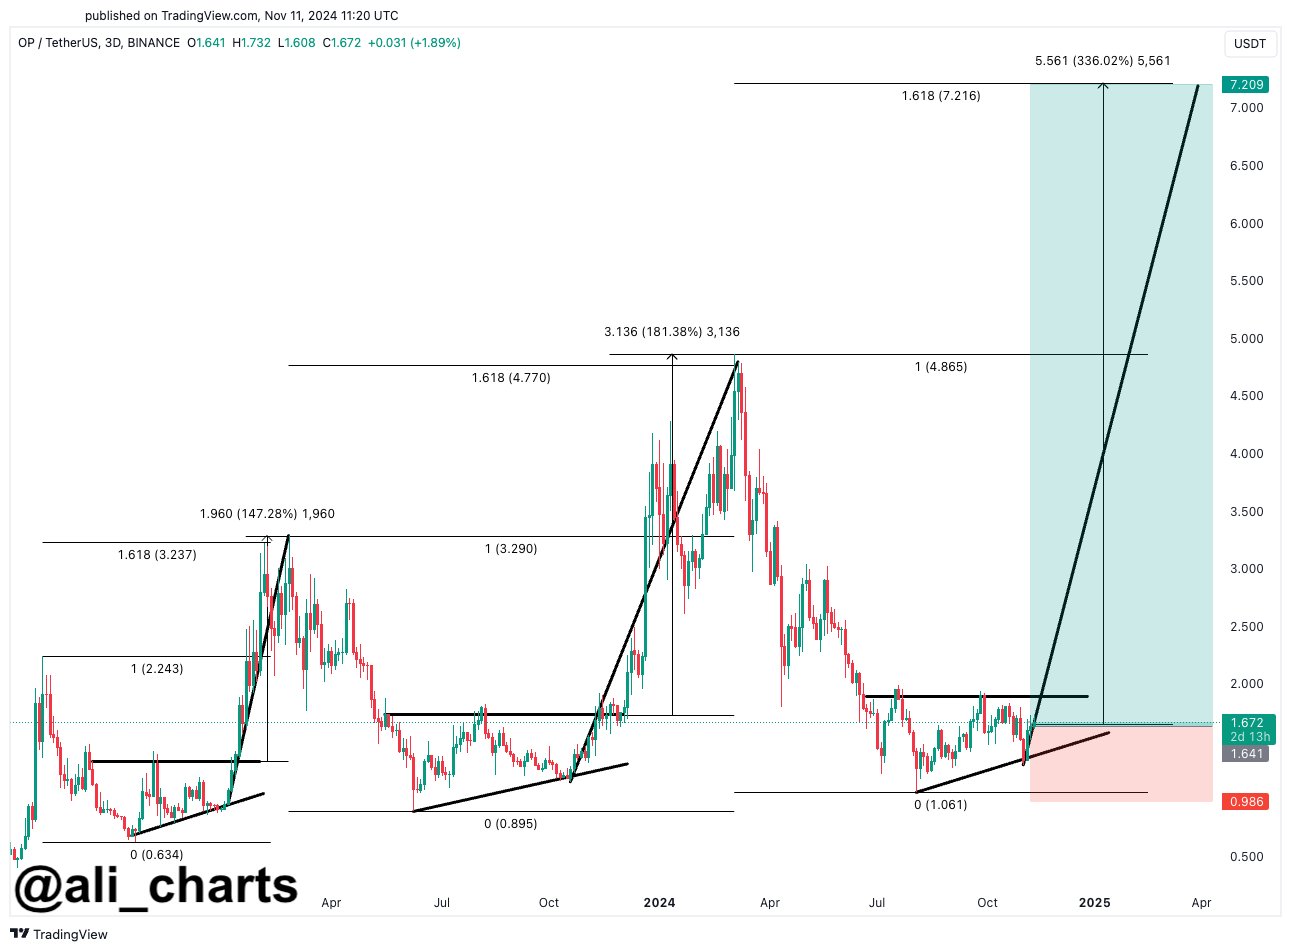
Optimism [OP] has been trading within a sideways range for the past five months, continuously struggling to break above the $2 resistance.
Despite the consolidation phase, crypto analyst Ali says suggested that this move formed an ascending triangle pattern, a historically bullish setup.
This setup could pave the way for a rally towards the expected Fibonacci target.
Potential for strong gains?
Optimism has shown a similar price movement before. The first breakout of the ascending triangle saw the price rise from around $1.00 to a peak near $3.23, delivering a 220% gain.
A second breakout occurred near $1.06, pushing the price to $4.77, marking a 350% increase.
Now analysts are eyeing a potential third breakout point around $1.85. If optimism follows its historical trend, the price could rise to $7.20, which corresponds to the 1.618 Fibonacci retracement level.
This would represent a 340% gain from the breakout level, reflecting past performance.
Source:
Current market dynamics and price movements
At the time of writing, Optimism was trading on $1.81This represents an increase of 11.09% in the last 24 hours and an increase of 31.03% in the last seven days.
The 24-hour trading volume at the time of writing was $1 billion, and the market capitalization was estimated at approximately $2.27 billion, with a circulating supply of 1.3 billion OP tokens.
Optimism’s current price was approaching the $1.85 resistance level. Breaking this threshold could confirm the ascending triangle break and lead to a sustained bullish rally.
Historical patterns suggested that optimism has formed similar structures in 2022 and 2023, both of which led to rapid price increases.
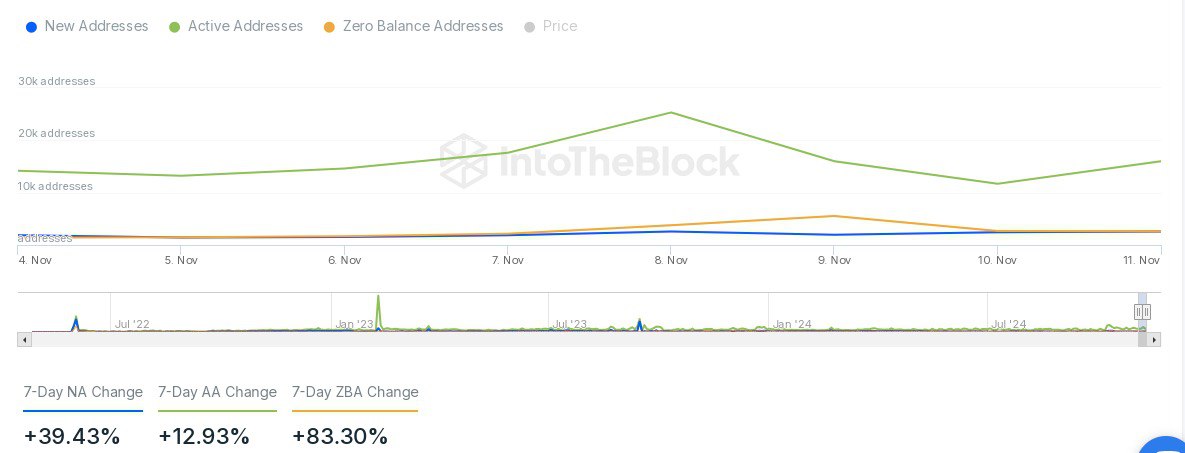
On-chain data reflects positive sentiment
On-chain statistics indicated a growing interest in optimism. A recent spike in new addresses saw a 39.43% increase over the past week, while active addresses rose 12.93%.
Additionally, zero-balance addresses increased by 83.30%, indicating previously inactive wallets are reconnecting to the network. These statistics indicate higher user participation and adoption.
Source: IntoTheBlock
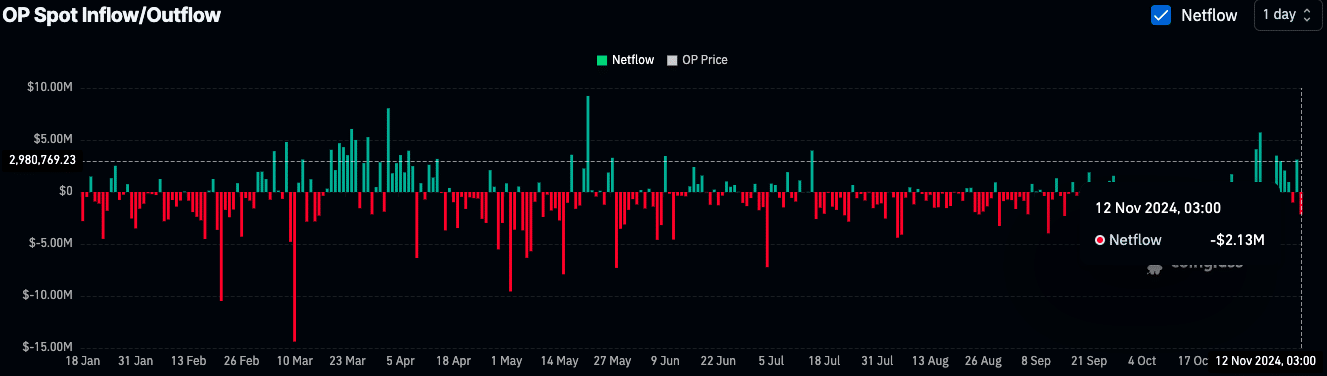
The exchange net flows also painted a bullish picture, said Coin glass data.
On November 12, OP recorded a net outflow of $2.13 million, indicating investors are withdrawing tokens from exchanges, possibly for long-term holdings.
Historically, such outflows have coincided with price increases, indicating reduced selling pressure.
Source: Coinglass
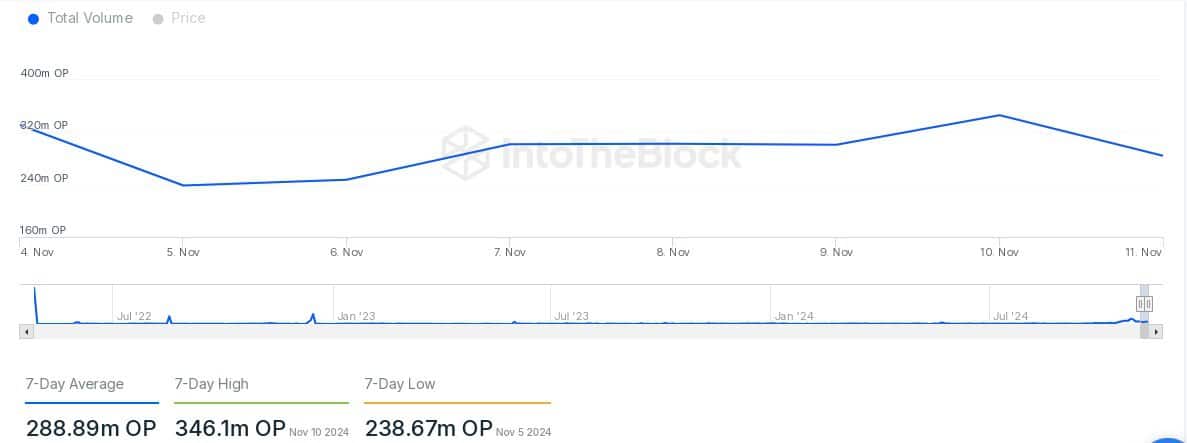
Continued trading activity is supporting growth
Transaction volume data further supported the bullish outlook. Optimism’s seven-day average transaction volume was 288.89 million OP, peaking at 346.1 million on November 10.
Read Optimism [OP] Price forecast 2024–2025
The lowest recorded volume was 238.67 million OP on November 5.
Source: IntoTheBlock
This steady trading activity reflected consistent liquidity and network utility, which could provide the foundation for future price growth.