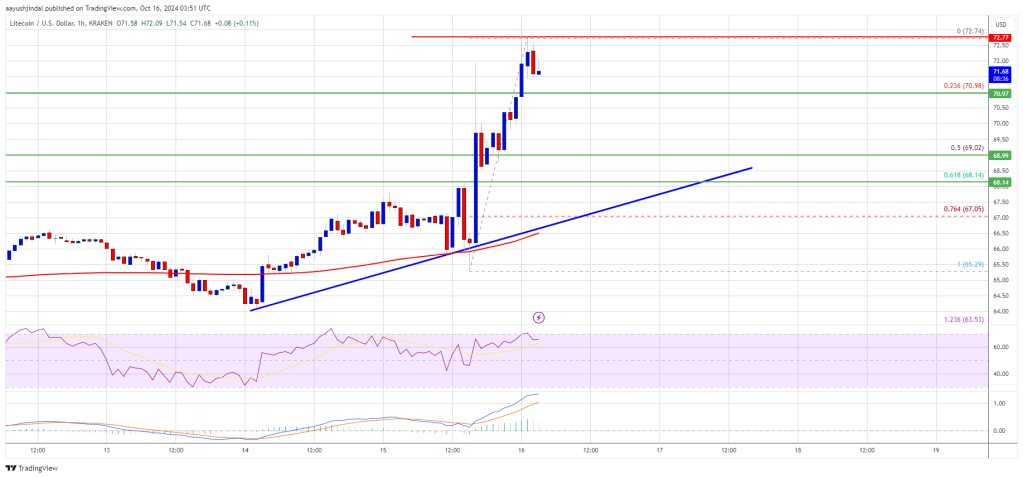
Litecoin price is rapidly gaining above the $70.00 level against the US dollar. The LTC could continue to rise if it crosses the USD 72.80 resistance zone.
- Litecoin is showing positive signs from the $65 support zone against the US dollar.
- The price is now trading above $70 and the 100-hourly Simple Moving Average.
- A major bullish trendline is forming with support at $68.00 on the hourly chart of the LTC/USD pair (data feed from Kraken).
- The price is up over 10% and could continue to rise if it crosses the USD 72.80 resistance zone.
Litecoin price gains bullish momentum
After forming a base above $65, Litecoin started a new rise. The LTC price broke the USD 68 and USD 70 resistance levels and entered a positive zone, like that of Bitcoin and Ethereum.
The price rose by more than 10% and even exceeded the $72 level. It reached a high at $72.74 and the price is now consolidating gains. It is steady above the 23.6% Fib retracement level of the upward move from the $65.29 swing low to the $72.74 high.
Litecoin is now trading above $70 and the 100 simple moving average (4 hours). There is also a major bullish trendline forming with support at $68.00 on the hourly chart of the LTC/USD pair. The trendline is close to the 61.8% Fib retracement level of the upward move from the $65.29 swing low to the $72.74 high.

On the upside, immediate resistance is near the $72.00 zone. The next major resistance is near the $72.80 level. If there is a clear break above the USD 72.80 resistance, the price could trigger another strong rise. In the said case, the price is likely to continue higher towards the USD 75.50 and USD 78.00 levels. Any further gains could send the price of LTC towards the USD 80.00 resistance zone.
Are dips supported in LTC?
If Litecoin price fails to break the USD 72 resistance level, a downward correction may occur. The initial downside support is near the $71.00 level.
The next major support is forming near the $69.00 level, below which there is a risk of a move towards the $67.50 support. Any further losses could perhaps send the price towards the $65.00 support.
Technical indicators:
Hourly MACD – The MACD is now gaining speed in the bullish zone.
Hourly RSI (Relative Strength Index) – The RSI for LTC/USD is above the 60 level.
Major support levels – $71.00 followed by $67.50.
Major resistance levels – $72.80 and $80.00.

