

XRP is compressing into a clearly defined post-breakout range on the weekly chart, and analyst Maelius (@MaeliusCrypto) argues that the next directional clue will come from the RSI, with a breakout “sometime in the first quarter” that he expects to coincide with higher prices and a push towards $10.
Maelius’ chart is a 1W XRP/USD view (Bitstamp) with a 50-week EMA overlay. The market’s most recent regime shift is clear: a sharp vertical expansion took XRP from a long base to a higher trading band, followed by a multi-week consolidation within a shaded range.
Is XRP About to Explode in 1 Week?
That range is anchored by two levels that the chart highlights. The upper limit matches the previous peak of $3.33 (the 2018 peak), while the lower limit is just above $1.60. At the time of the screenshot,
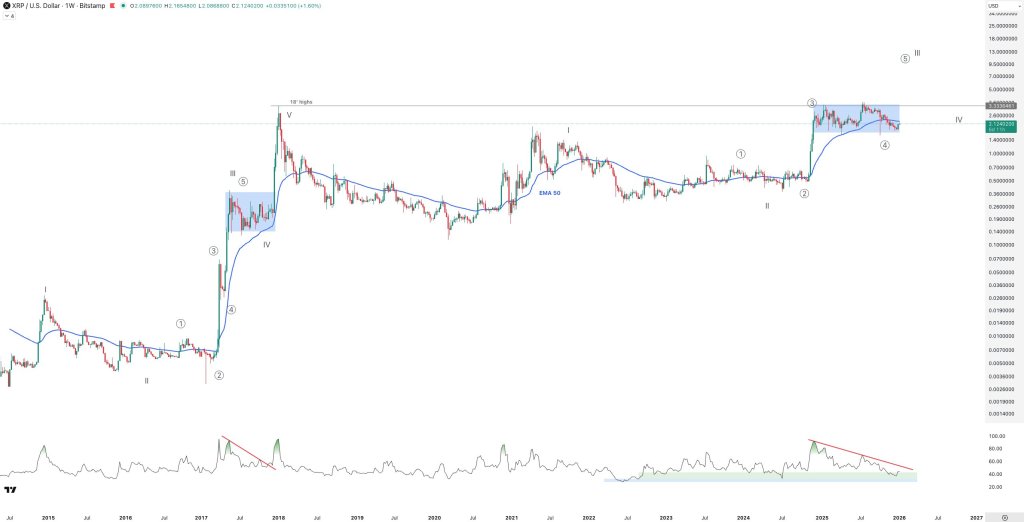
The Elliott labeling casts the current chop as a corrective wave 4 after the impulsive advance. The message is less ‘the trend is broken’ and more ‘the trend is on pause’. Maelius added that his “conservative count assumes there is only 1W left,” implying there is a relatively tight window for the market to resolve consolidation and move into wave 5 if momentum asserts itself.
Related reading
The broader layout of the chart also invites a comparison with 2017: XRP’s first big run from a base, a long mid-cycle breather, and then a second, sharper leg to the ultimate high. In the comparison in the chart, XRP rose about 7,400% in about three months in early 2017, consolidated from May through December, and then rose again by about 1,500%.
The current sequence is presented as similar in form, if not necessarily in magnitude: a strong first leg from roughly November 2024 through January 2025 (about +500%), followed by a year-long consolidation through January 2026. In that sense, the next big leg could be higher up, possibly shallower than the first, with wave 5 serving as the “second push” analogue.
Related reading
The bottom panel is a weekly RSI with a descending trendline capping recent peaks. That red downward line is Maelius’ timing trigger: “RSI breaks out sometime in the first quarter. The price goes higher.” The implication is simple. In his framework, momentum must break its own compression before price can support the next phase of expansion.
Crucially, the card also carries a higher quality label, which places the current wave 4 within a larger wave III, rather than portraying the next wave 5 as a final, cycle-ending move. That’s consistent with his response when asked if $10 would be a quarterly “max”: “Sometime in the first quarter we should get a breakout, not necessarily a top. The next wave should be towards $10.”
If the thesis works, XRP is expected to regain the 50-week EMA and reaffirm acceptance towards the highs in the range around $3.33, with the RSI trendline break acting as the confirmation event that Maelius is looking at. If it fails, a continued rejection at the EMA and a break above $1.60 would maintain the wave 4 correction phase and delay the wave 5 path he has charted.
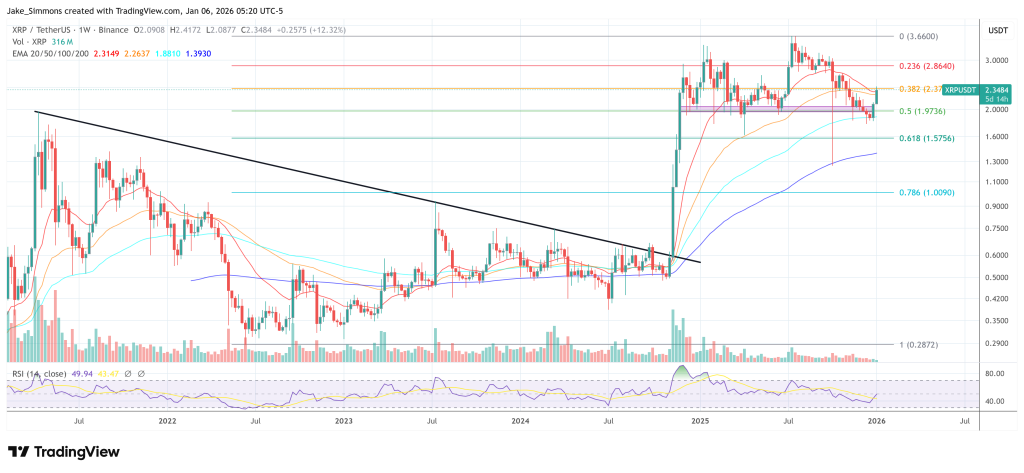
At the time of writing, XRP was trading at $2.37.
Featured image created with DALL.E, chart from TradingView.com