- XRP consolidated within a bullish triangle, suggesting a potential 299% upside to $2.00.
- Technical indicators supported a bullish breakout, with strong network activity and volume.
Ripple [XRP] at the time of writing, showed clear indications of a potential major upside breakout, driven by the formation of a long-established bullish triangle pattern.
This technical setup typically indicates significant price movement, with traders and investors keeping an eye on a potential rally.
With key technical indicators and on-chain metrics aligning, could XRP be on the verge of an explosive move?
Could the bullish triangle lead to a 299% increase?
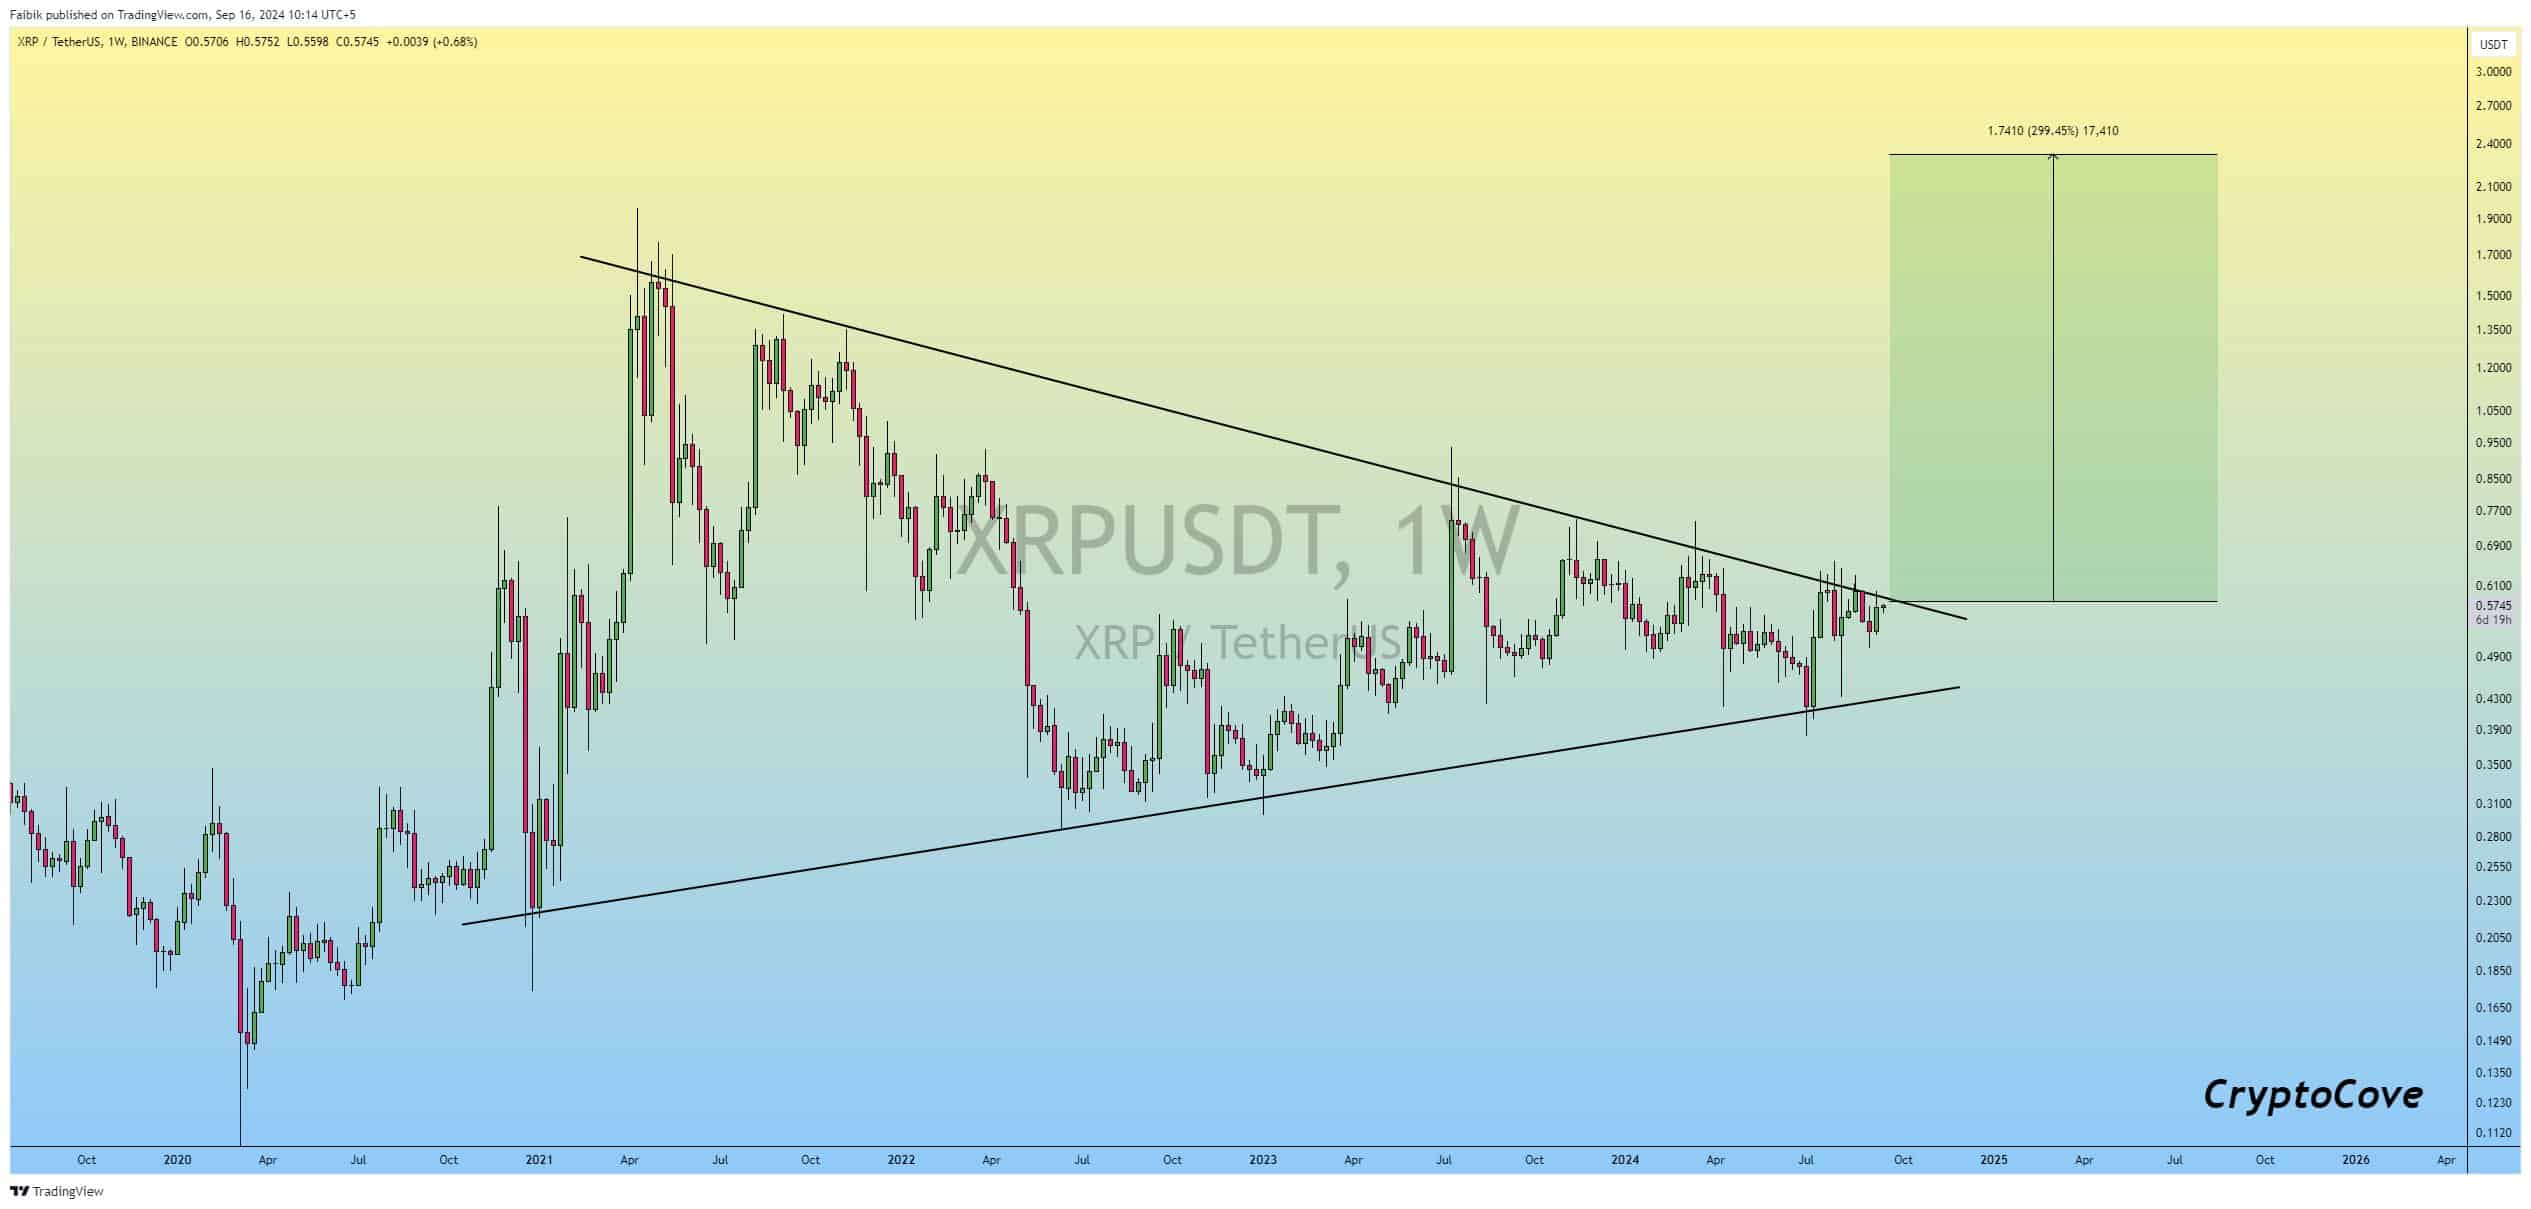
The price of XRP is consolidating within a tightening triangle pattern, with resistance at $0.61 and support around $0.55. As the price falls, the chance of a breakout increases.
If XRP breaks above resistance, an upside of up to 299% could be in store, pushing the price towards $2.00. according to to analyst Captain Faibik on X (formerly Twitter).
XRP’s next move will be crucial, with the price at $0.572 at the time of writing. A confirmed break above resistance could lead to a strong upside rally, presenting traders with a favorable risk-reward opportunity.


Source:
Data in the chain
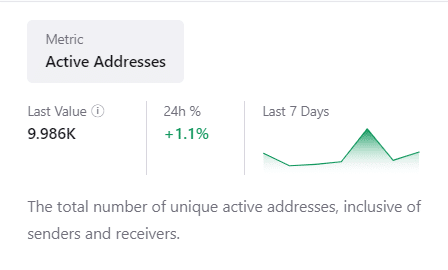
On-chain statistics suggested growing momentum for XRP. The number of active addresses increased by 1.1% to 9,986 in the past 24 hours.
This increase in activity indicated increasing engagement in the XRP network, a sign that investors may be preparing for a price move.


Source: Cryptoquant
Furthermore, XRP’s 24-hour trading volume reached $1.03 billion, with a volume-to-market cap ratio of 3.01%. This level of liquidity reflected strong market interest, a key factor in confirming a possible breakout.
The liquidation data also supported the bullish scenario, with $973.39K in long positions opened on major exchanges like Binance, compared to just $72.34K in shorts.
This imbalance indicated growing market confidence in XRP’s potential to rise.


Source: Coinglass
Do the technical indicators match?
Technical indicators are in place to support a possible breakout.
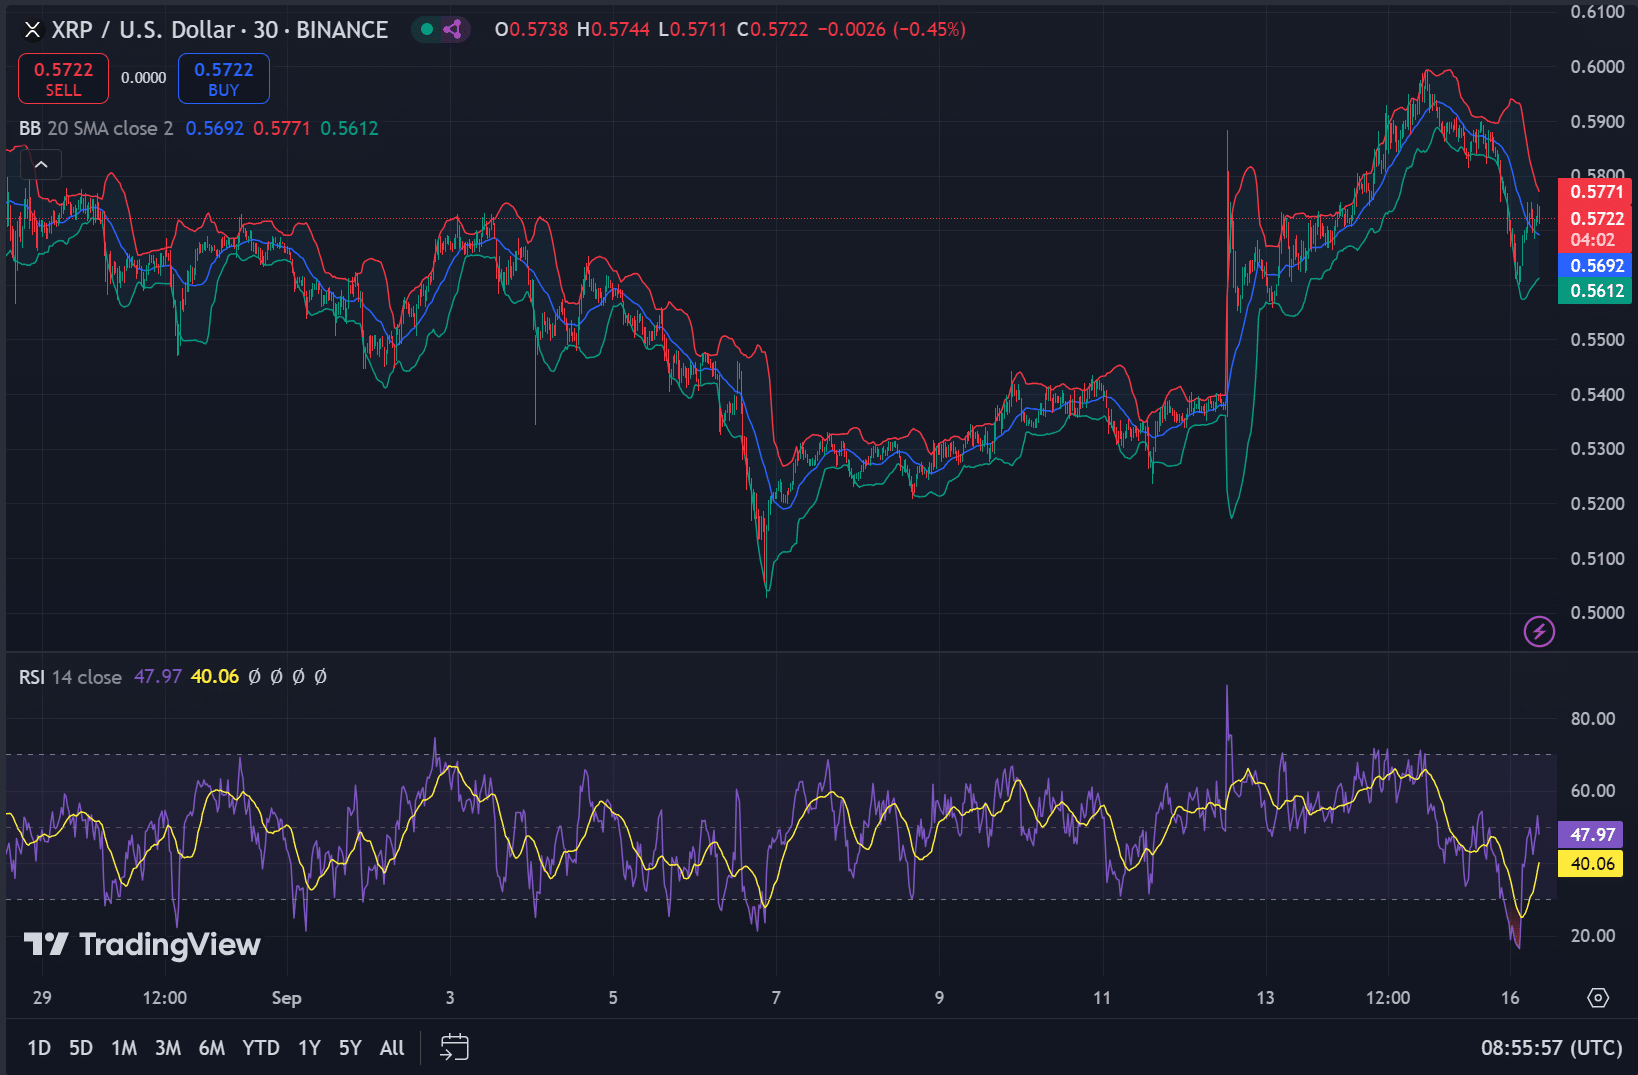
The Relative Strength Index (RSI) stood at 47.97 at the time of writing, a neutral level that provides ample room for upward movement without the risk of being overbought.
Bollinger Bands on the 30-minute chart showed increasing volatility, another sign that XRP could be poised for a strong price move.


Source: TradingView
Read XRP’s 2024-2025 Price Prediction
Will XRP Break Out Soon?
With the bullish triangle pattern forming and on-chain metrics showing increased activity, XRP appears poised for a breakout. If it can break the key resistance level at USD 0.61, the price could rise to 299% and reach USD 2.00.
Traders should keep a close eye on volume and key technical levels in the coming days to confirm this potential move.

