

Bitcoin price remains stable above the $60,000 zone. BTC is now consolidating gains and the bulls could aim for a move above the USD 62,000 resistance zone.
- Bitcoin entered a consolidation phase above the $60,000 zone.
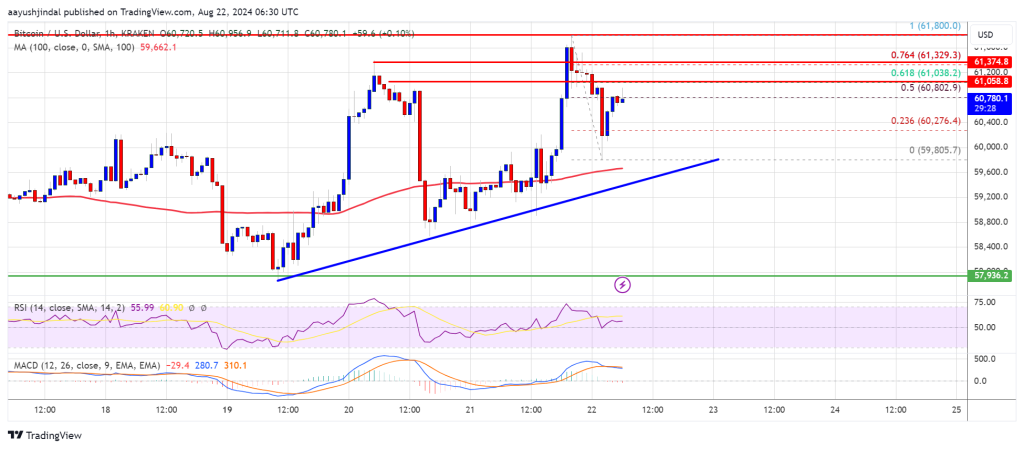
- The price is trading above USD 59,500 and the 100 hourly Simple Moving Average.
- A major bullish trendline is forming with support at $59,800 on the hourly chart of the BTC/USD pair (data feed from Kraken).
- The pair could attempt another rise if it breaks the $61,500 resistance zone.
Bitcoin price holds gains
Bitcoin price held steady above the USD 58,500 pivot level. BTC formed a base and started a steady rise above the $60,000 resistance zone. The price climbed above the USD 60,200 and USD 60,500 resistance levels.
The bulls were able to push the price above the 23.6% Fib retracement level of the downward move from the $61,800 swing high to the $59,805 low. The current price action is positive and it seems like the bulls could aim for more gains above the USD 60,800 resistance zone.
Bitcoin is now trading above $60,200 and the 100 hourly Simple Moving Average. The price is now consolidating near the 50% Fib retracement level of the downward move from the $61,800 swing high to the $59,805 low.
On the upside, the price could encounter resistance around the $60,800 level. The first major resistance is near the $61,800 level. A clear move above the USD 61,800 resistance could push the price further higher in the coming sessions. The next major resistance could be at USD 62,000.
A close above the $62,000 resistance could provide more upside. In the mentioned case, the price could rise and test the USD 63,500 resistance.
Another drop in BTC?
If Bitcoin fails to rise above the USD 61,800 resistance zone, a downward correction could occur. The immediate downside support is near the USD 60,200 level.
The first major support is at $59,800. The next support is now near the $58,500 zone. Any further losses could send the price towards the $58,000 support zone or even $57,500 in the near term.
Technical indicators:
Hourly MACD – The MACD is now gaining speed in the bullish zone.
Hourly RSI (Relative Strength Index) – The RSI for BTC/USD is now above the 50 level.
Major support levels – USD 60,200, followed by USD 59,800.
Major resistance levels – $60,800 and $61,800.