In his new monthly magazine report Titled “The Bitcoin Monthly: Bitcoin Battles Resistance Around Its On-Chain Mean,” Ark Invest has provided a comprehensive analysis of the current market landscape. The report categorizes its findings into bullish, neutral, and bearish perspectives, providing a holistic view of Bitcoin’s current and potential future stance.
Bullish arguments for Bitcoin
Grayscale Spot ETF and GBTC Discount on NAV: On August 29, a crucial decision was made by a US Federal Court of Appeals. They ruled that the US Securities and Exchange Commission (SEC) should review and reconsider its earlier rejection of the Grayscale Bitcoin Trust’s (GBTC) application to switch to a spot ETF. This legal development pushed GBTC’s discount to NAV from -24% to -18% on the same day, indicating heightened market optimism. At the end of August, GBTC was discounted to NAV at -20.6%.
Bitcoin’s Overall Cost Base Recovery: Bitcoin’s realized capitalization, which includes both the primary (miners) and secondary (investors) markets, is a measure of BTC’s total cost base. Between the fourth quarter of 2022 and the first quarter of 2023, the realized limit decline was -19%, the steepest since 2012. This decline serves as a barometer for capital outflows from the network.
Ark’s analysis suggests that the deeper the decline, the more likely Bitcoin holders are to exit the market, potentially paving the way for a more robust bull market. The realized limit has improved from its all-time high in 2021, from a low of 19% following the collapse of the FTX in November 2022 to 15.6%, indicating capital inflows over the past eight months.
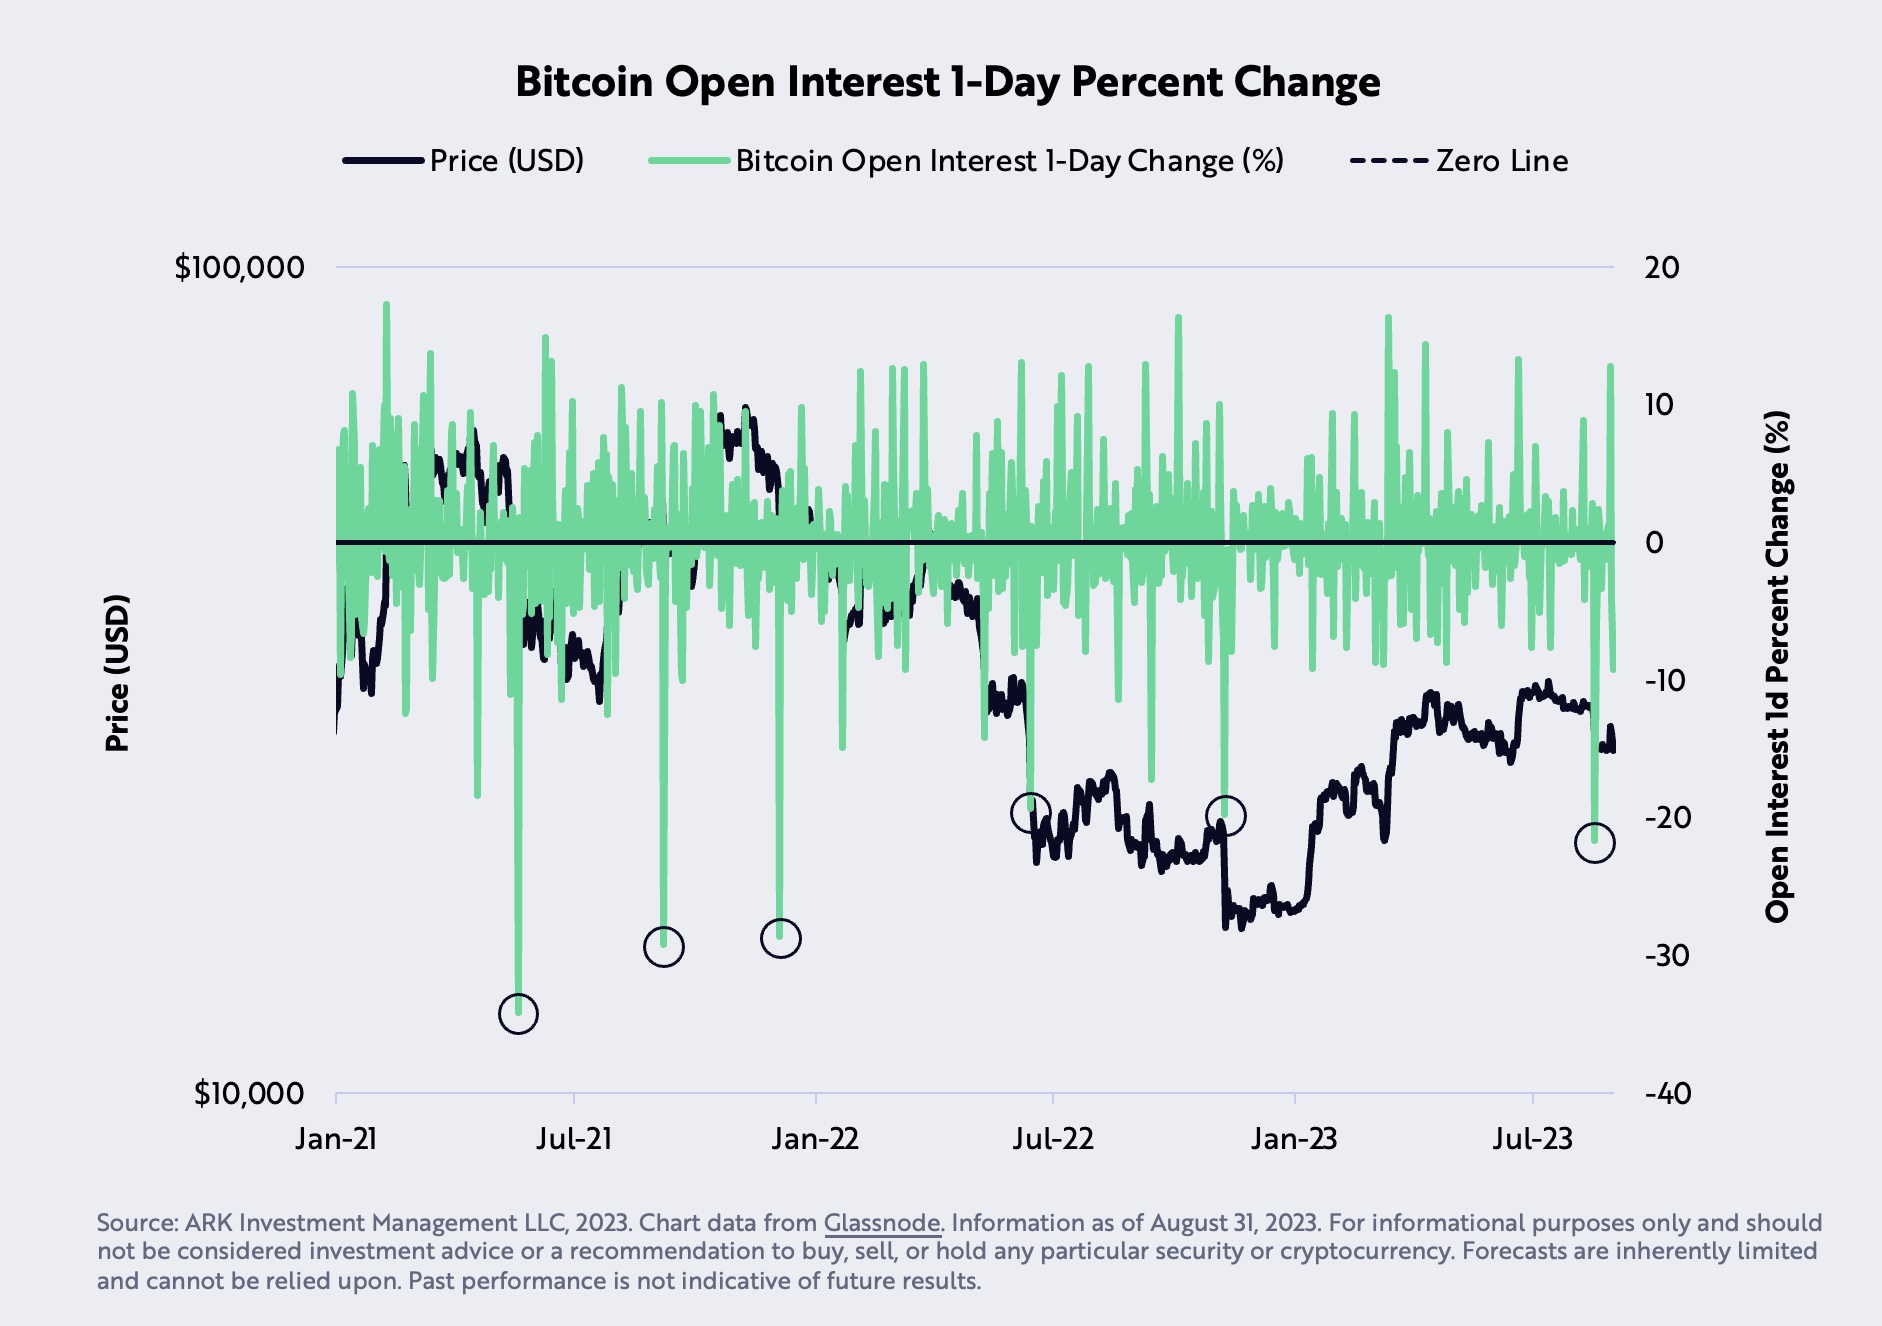
Futures open interest collapse: On August 17, there was a rapid liquidation of Bitcoin futures at 21.7%, the fastest since December 2021. Ark Invest interprets this price correction as a “redemptive sentiment correction.”

Neutral arguments
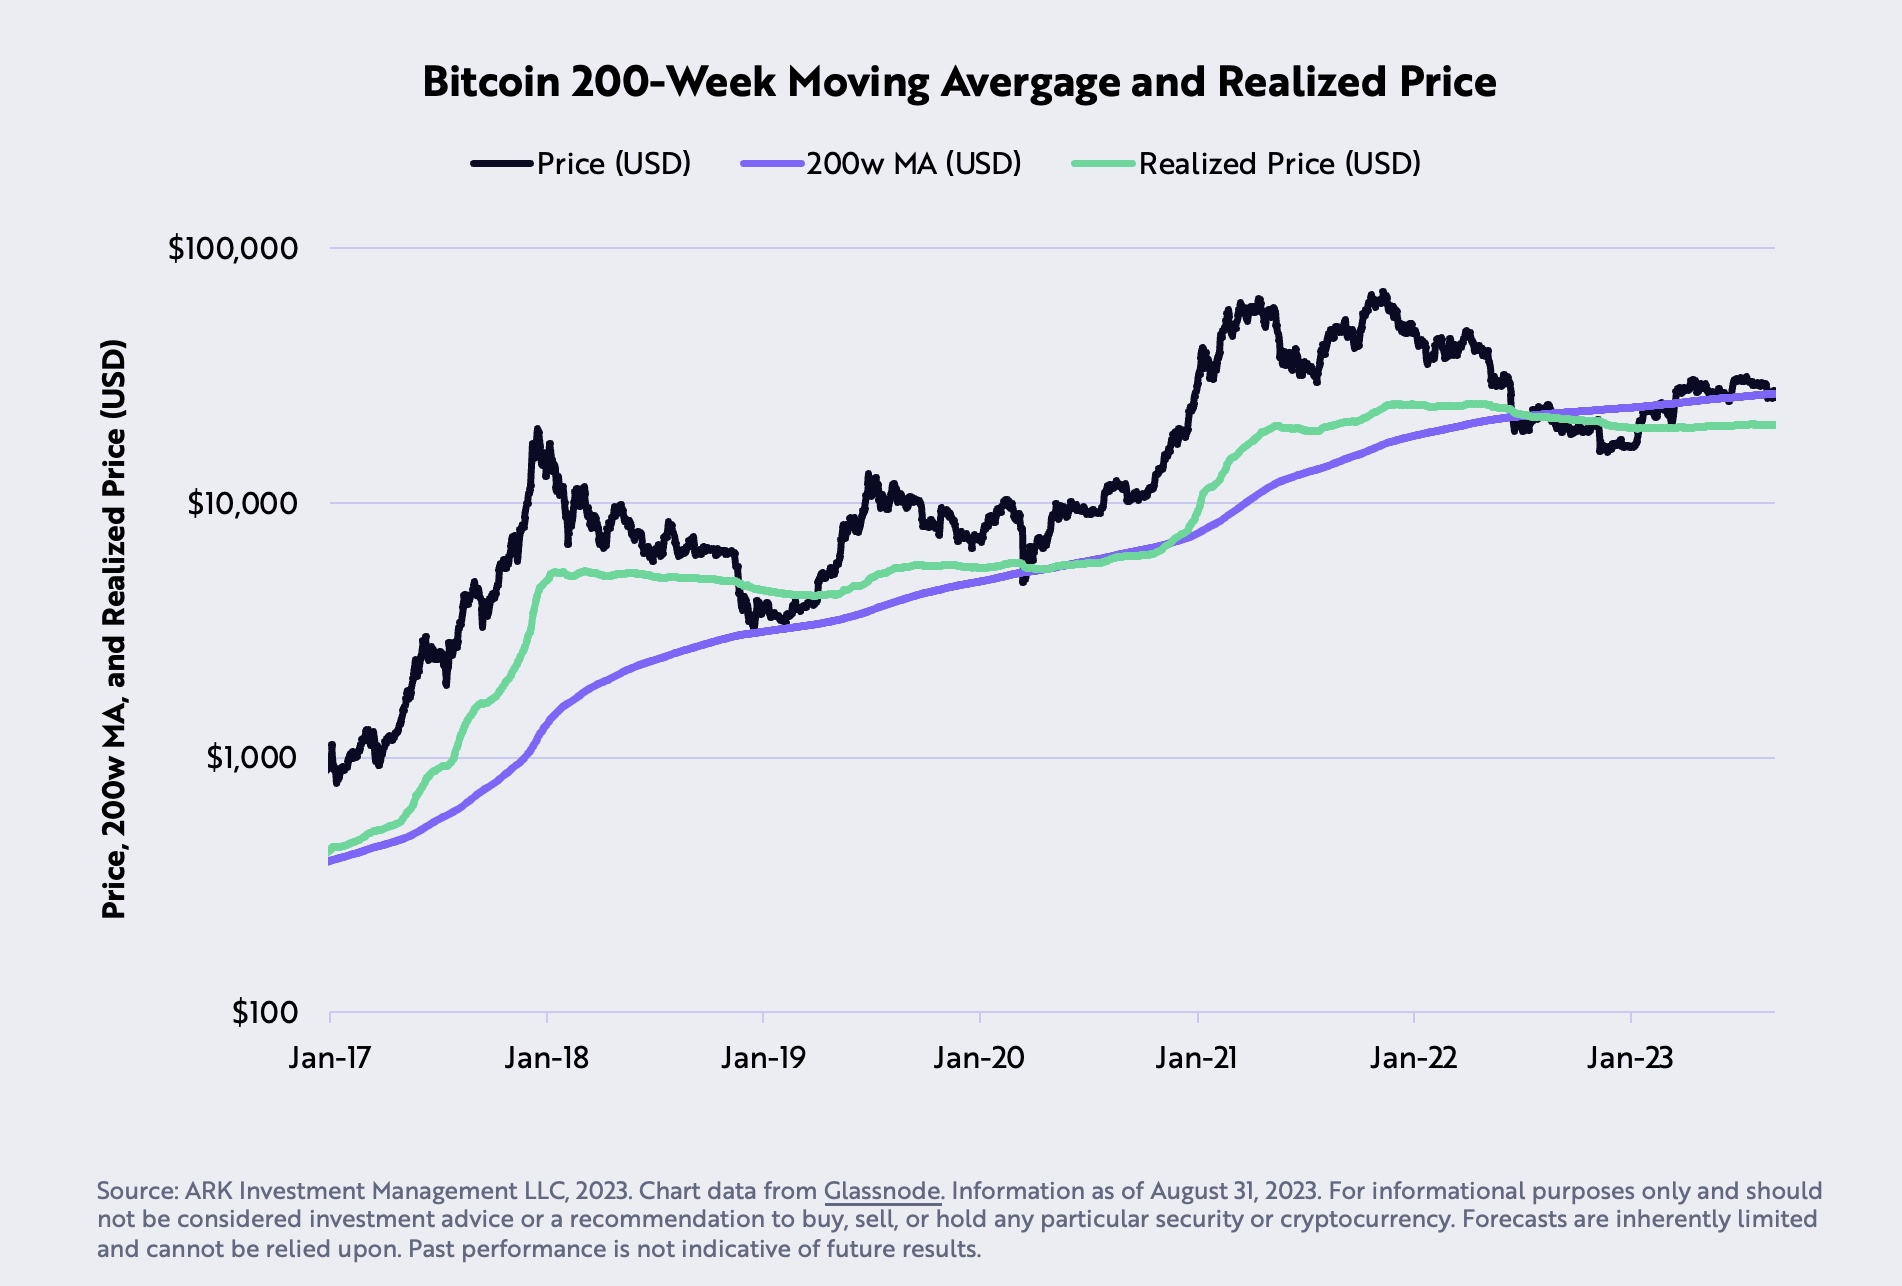
Bitcoin price and the 200-week moving average: August was a challenging month for Bitcoin as the price fell 5.4% and remained below the 200-week moving average of $27,580. This was the first case since June 2023. However, Ark Invest argues that Bitcoin should receive significant downside support at the realized price of $20,300.

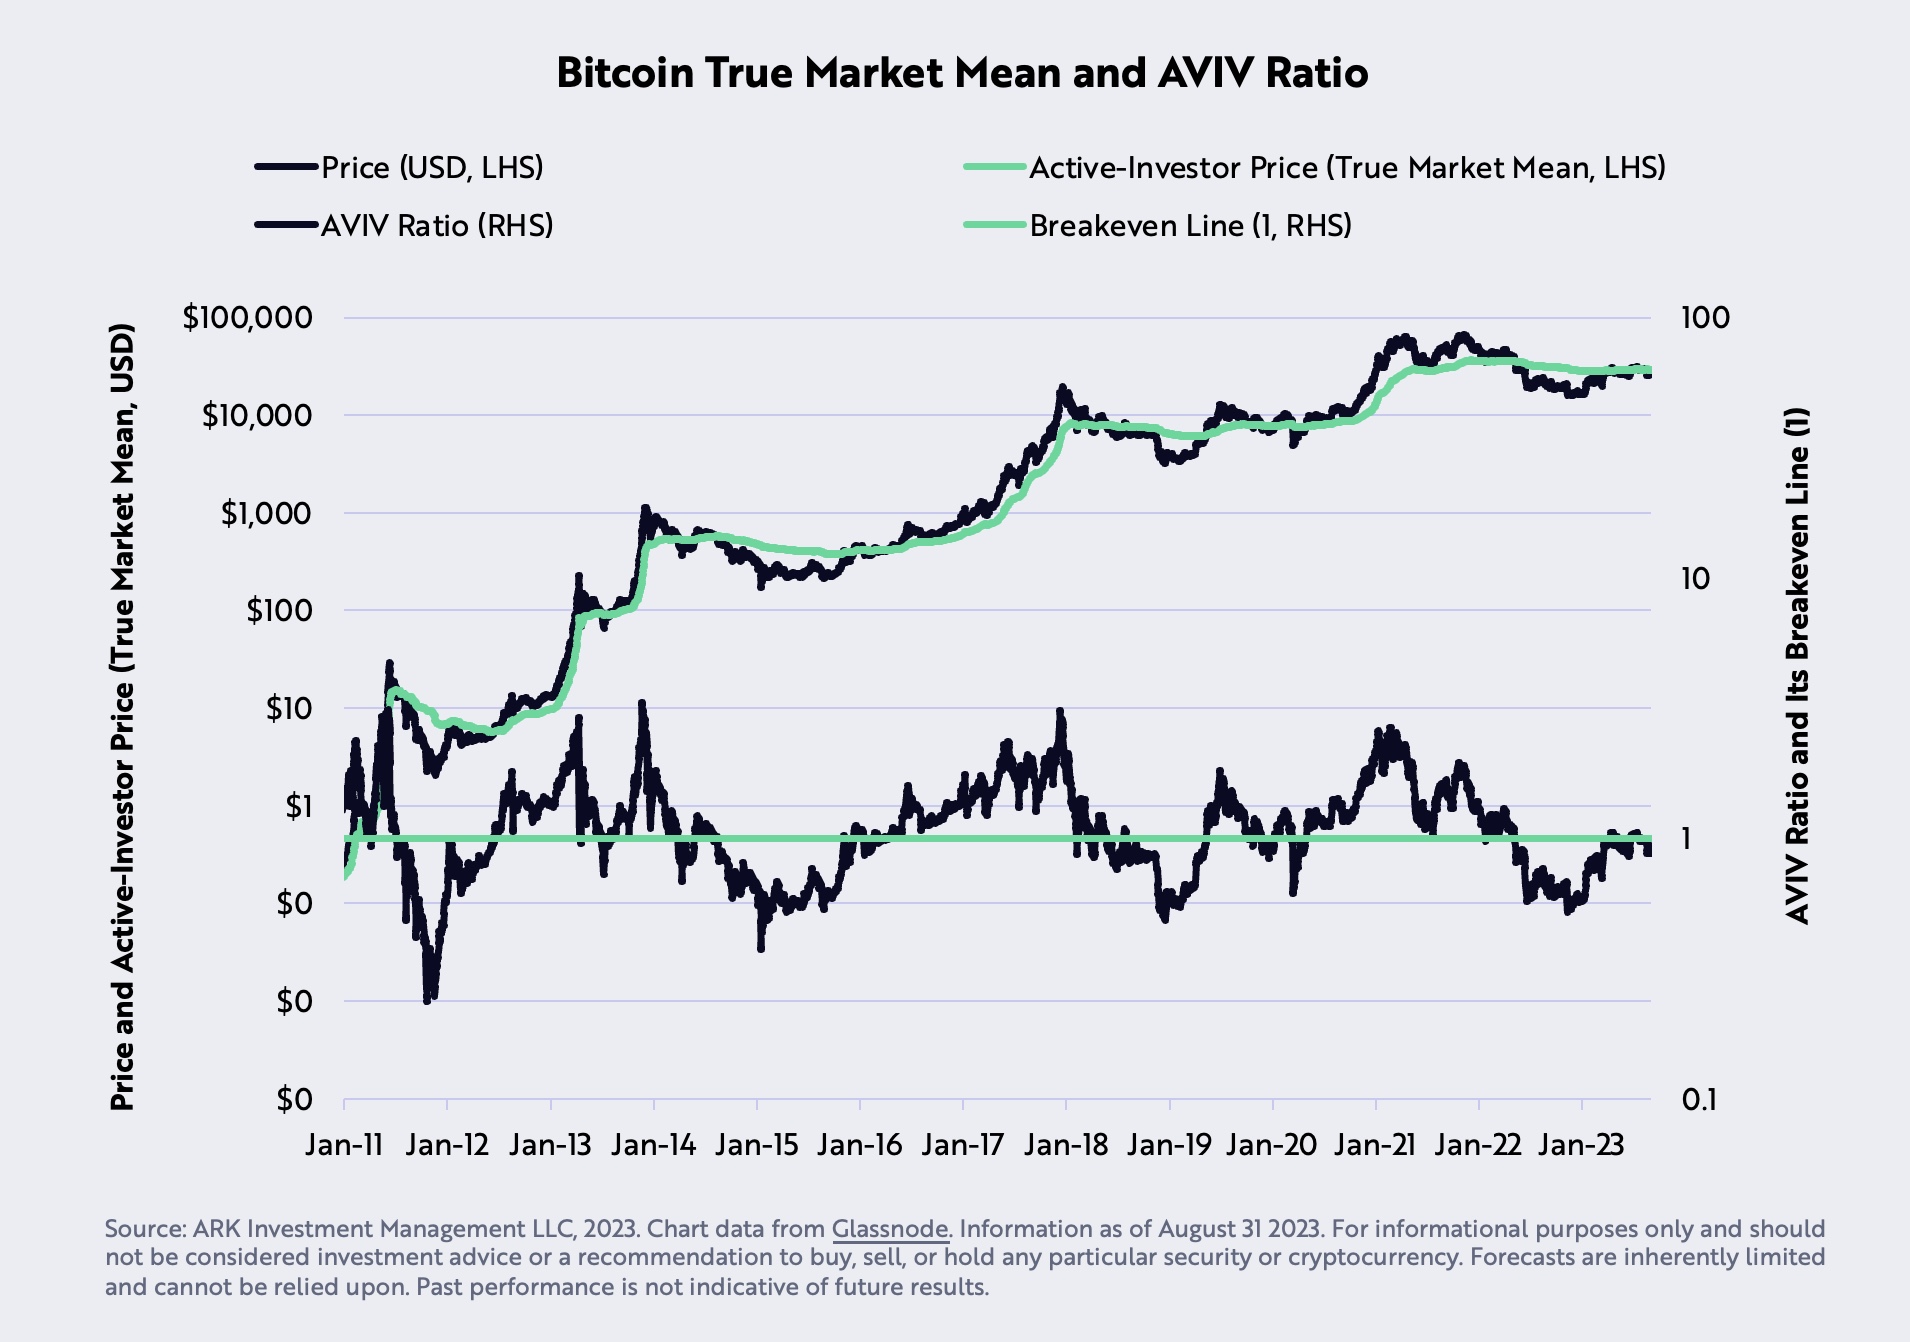
Bitcoin’s average resistance on the chain: The “on-chain average,” also referred to as the “active investor price” or “true market average,” reached $29,608 in August, creating potentially significant resistance for BTC. This metric, a collaboration between ARK Invest and Glassnode, is calculated by dividing the investor cost base by the number of active coins. These coins are determined by the total time they have been idle in relation to the total supply.

Market Capitalization and Liquidity of Stablecoins: Stablecoins, often viewed as a liquidity barometer for the market, have seen their supply fall by more than 20% over 90 days from $162 billion in March 2022 to $120 billion today, indicating a decline in on-chain liquidity. However, net inflows over the same period indicate building bullish market momentum.
Bearish Arguments for BTC (All Macro)
Real GDP vs Real FDI Growth Rates: A record difference has been observed between the annual percentage changes in real gross domestic product (GDP) and real gross domestic income (FDI). Historically, GDP and FDI should be aligned, since income earned should equal the value of goods and services produced. Former Federal Reserve economist Jeremy Nalewaik has argued that FDI could be a more accurate indicator than GDP.
Real Federal Funds Policy Rate vs. Natural Rate: For the first time since 2009, the Real Federal Funds Policy Rate has surpassed the natural rate, signaling a shift to a restrictive monetary policy. This theoretical rate, as conceptualized by New York Federal Reserve President John Williams, is the rate at which the economy is neither growing nor contracting. As the impact of monetary policy on the economy is protracted and variable, lending and borrowing are expected to face increasing downward pressures.
Review of government employment: Employment, a lagging indicator, has played a central role in the Federal Reserve’s rate decisions. Despite the labor disruptions caused by the COVID-19 pandemic which are now expected to be resolved, the government has revised non-farm wage statistics downward for six consecutive months. This points to a weaker labor market than initially reported. The last example of such a trend, other than a recession, occurred in 2007, just before the Great Financial Crisis.
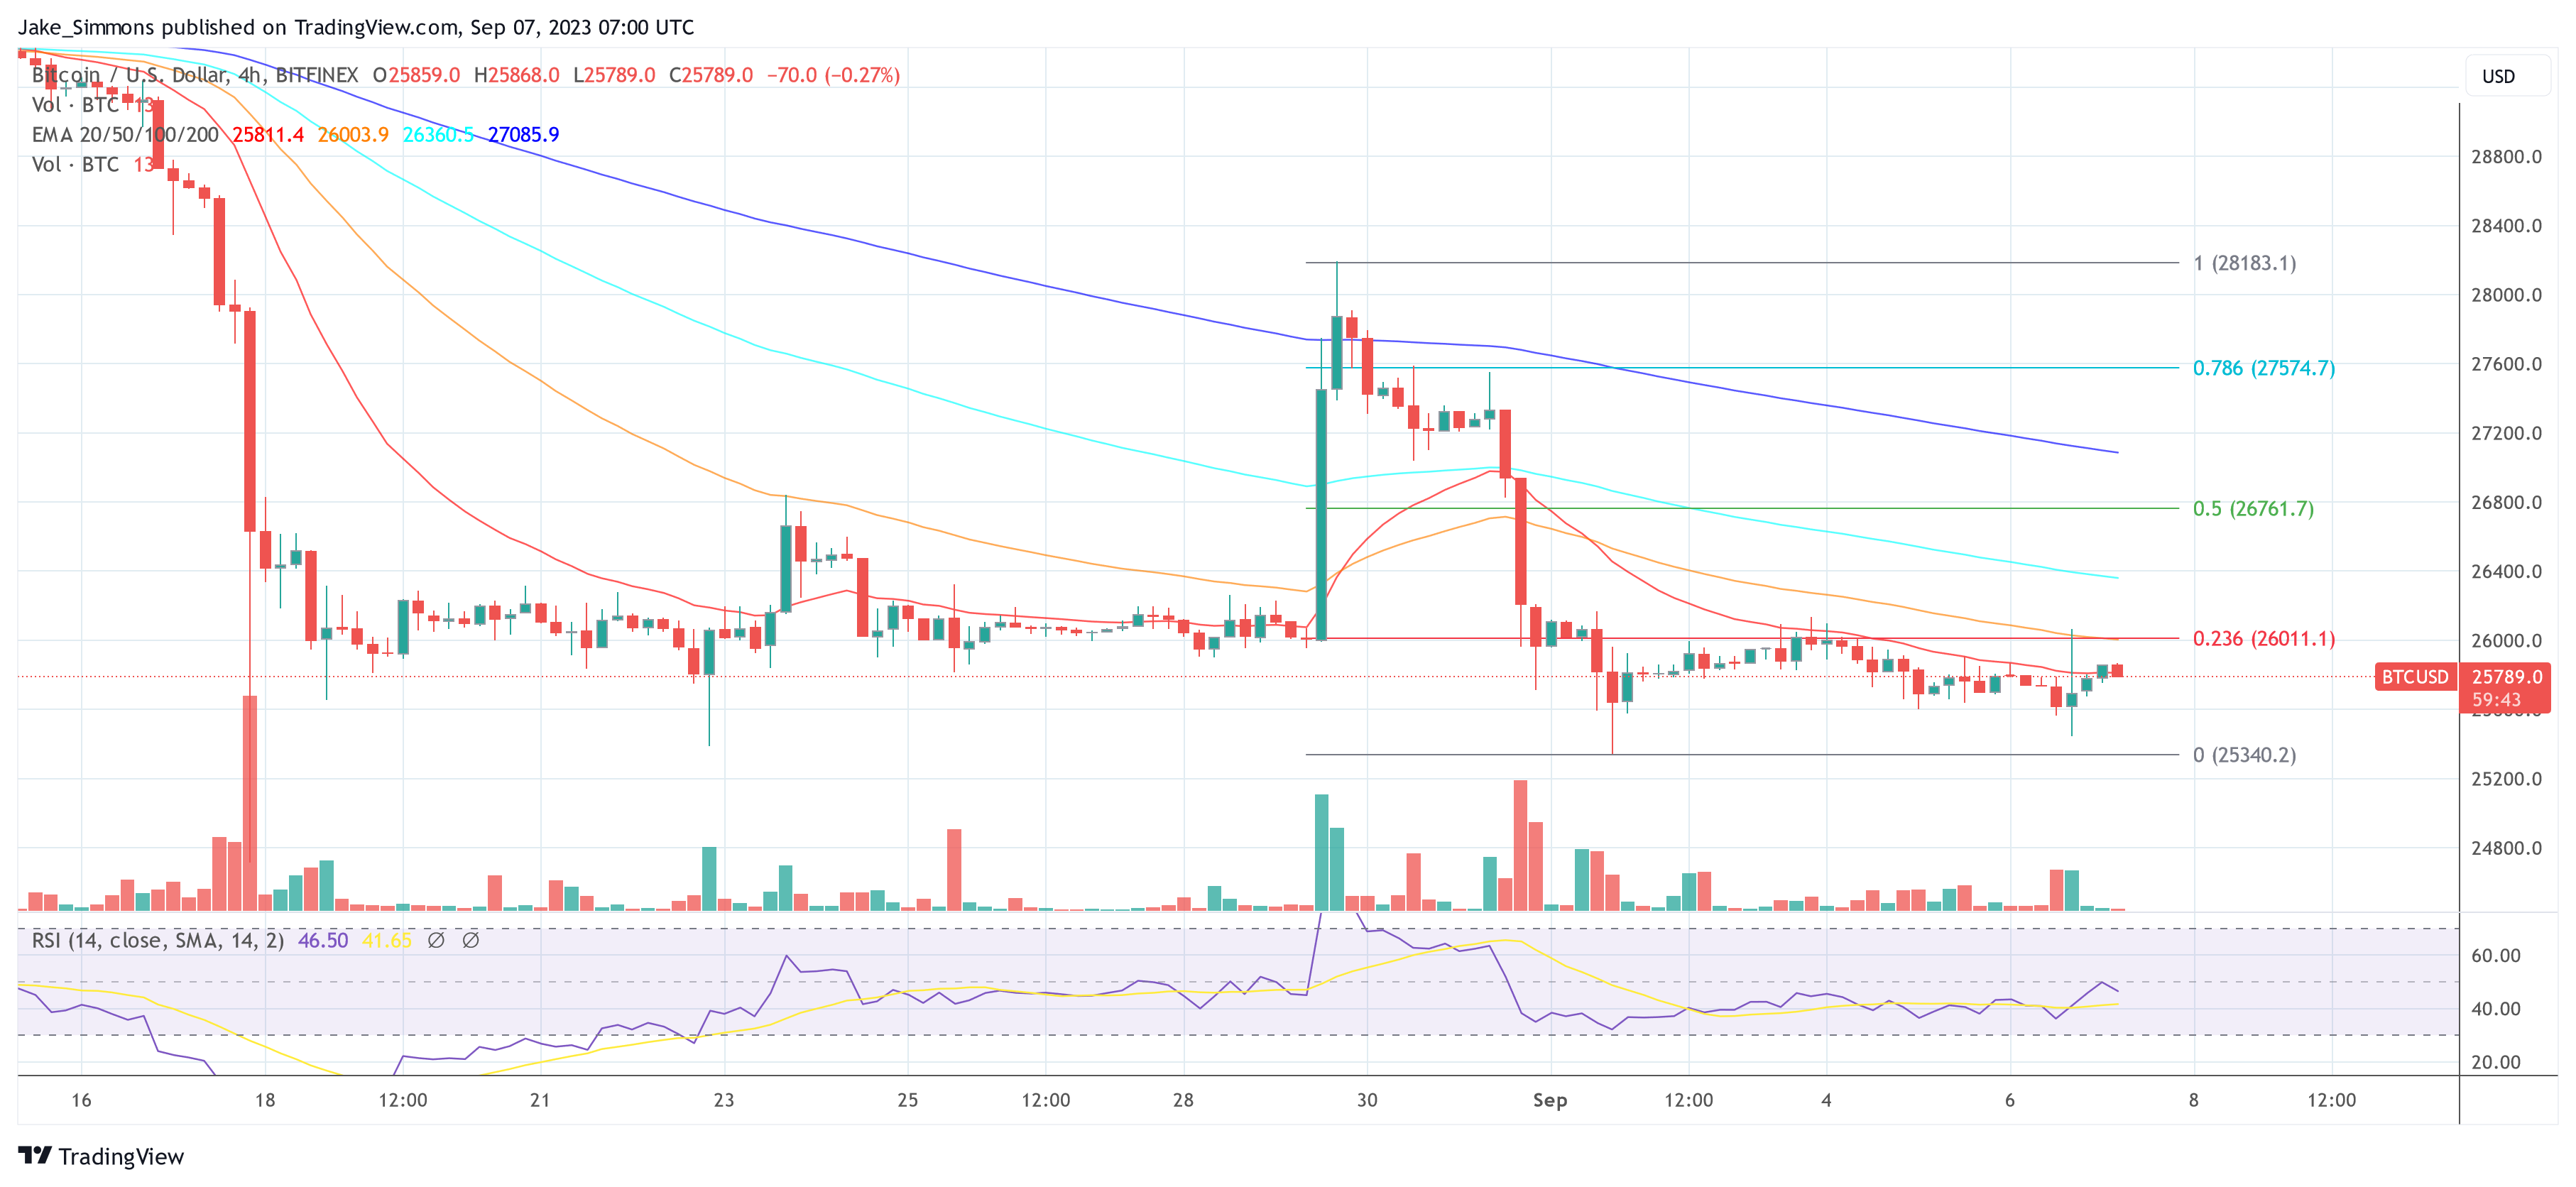
In summary, Ark Invest’s report presents three bullish, four neutral, and three bearish arguments about Bitcoin and the broader market, highlighting that the market could be at a critical turning point. At the time of writing, BTC was trading at $25,789.

Featured image from iStock, chart from TradingView.com

