

An analyst has pointed out two patterns forming in altcoin and Bitcoin-related charts that could indicate an altseason is coming soon.
Signs may finally be aligning for an Altcoin season
In two new posts on X, analyst Ali Martinez has discussed some signals that could predict an altcoin season. The first chart shared by the analyst is for the combined market cap of altcoins, which is simply the combined market cap for cryptocurrency, excluding Bitcoin and Ethereum.
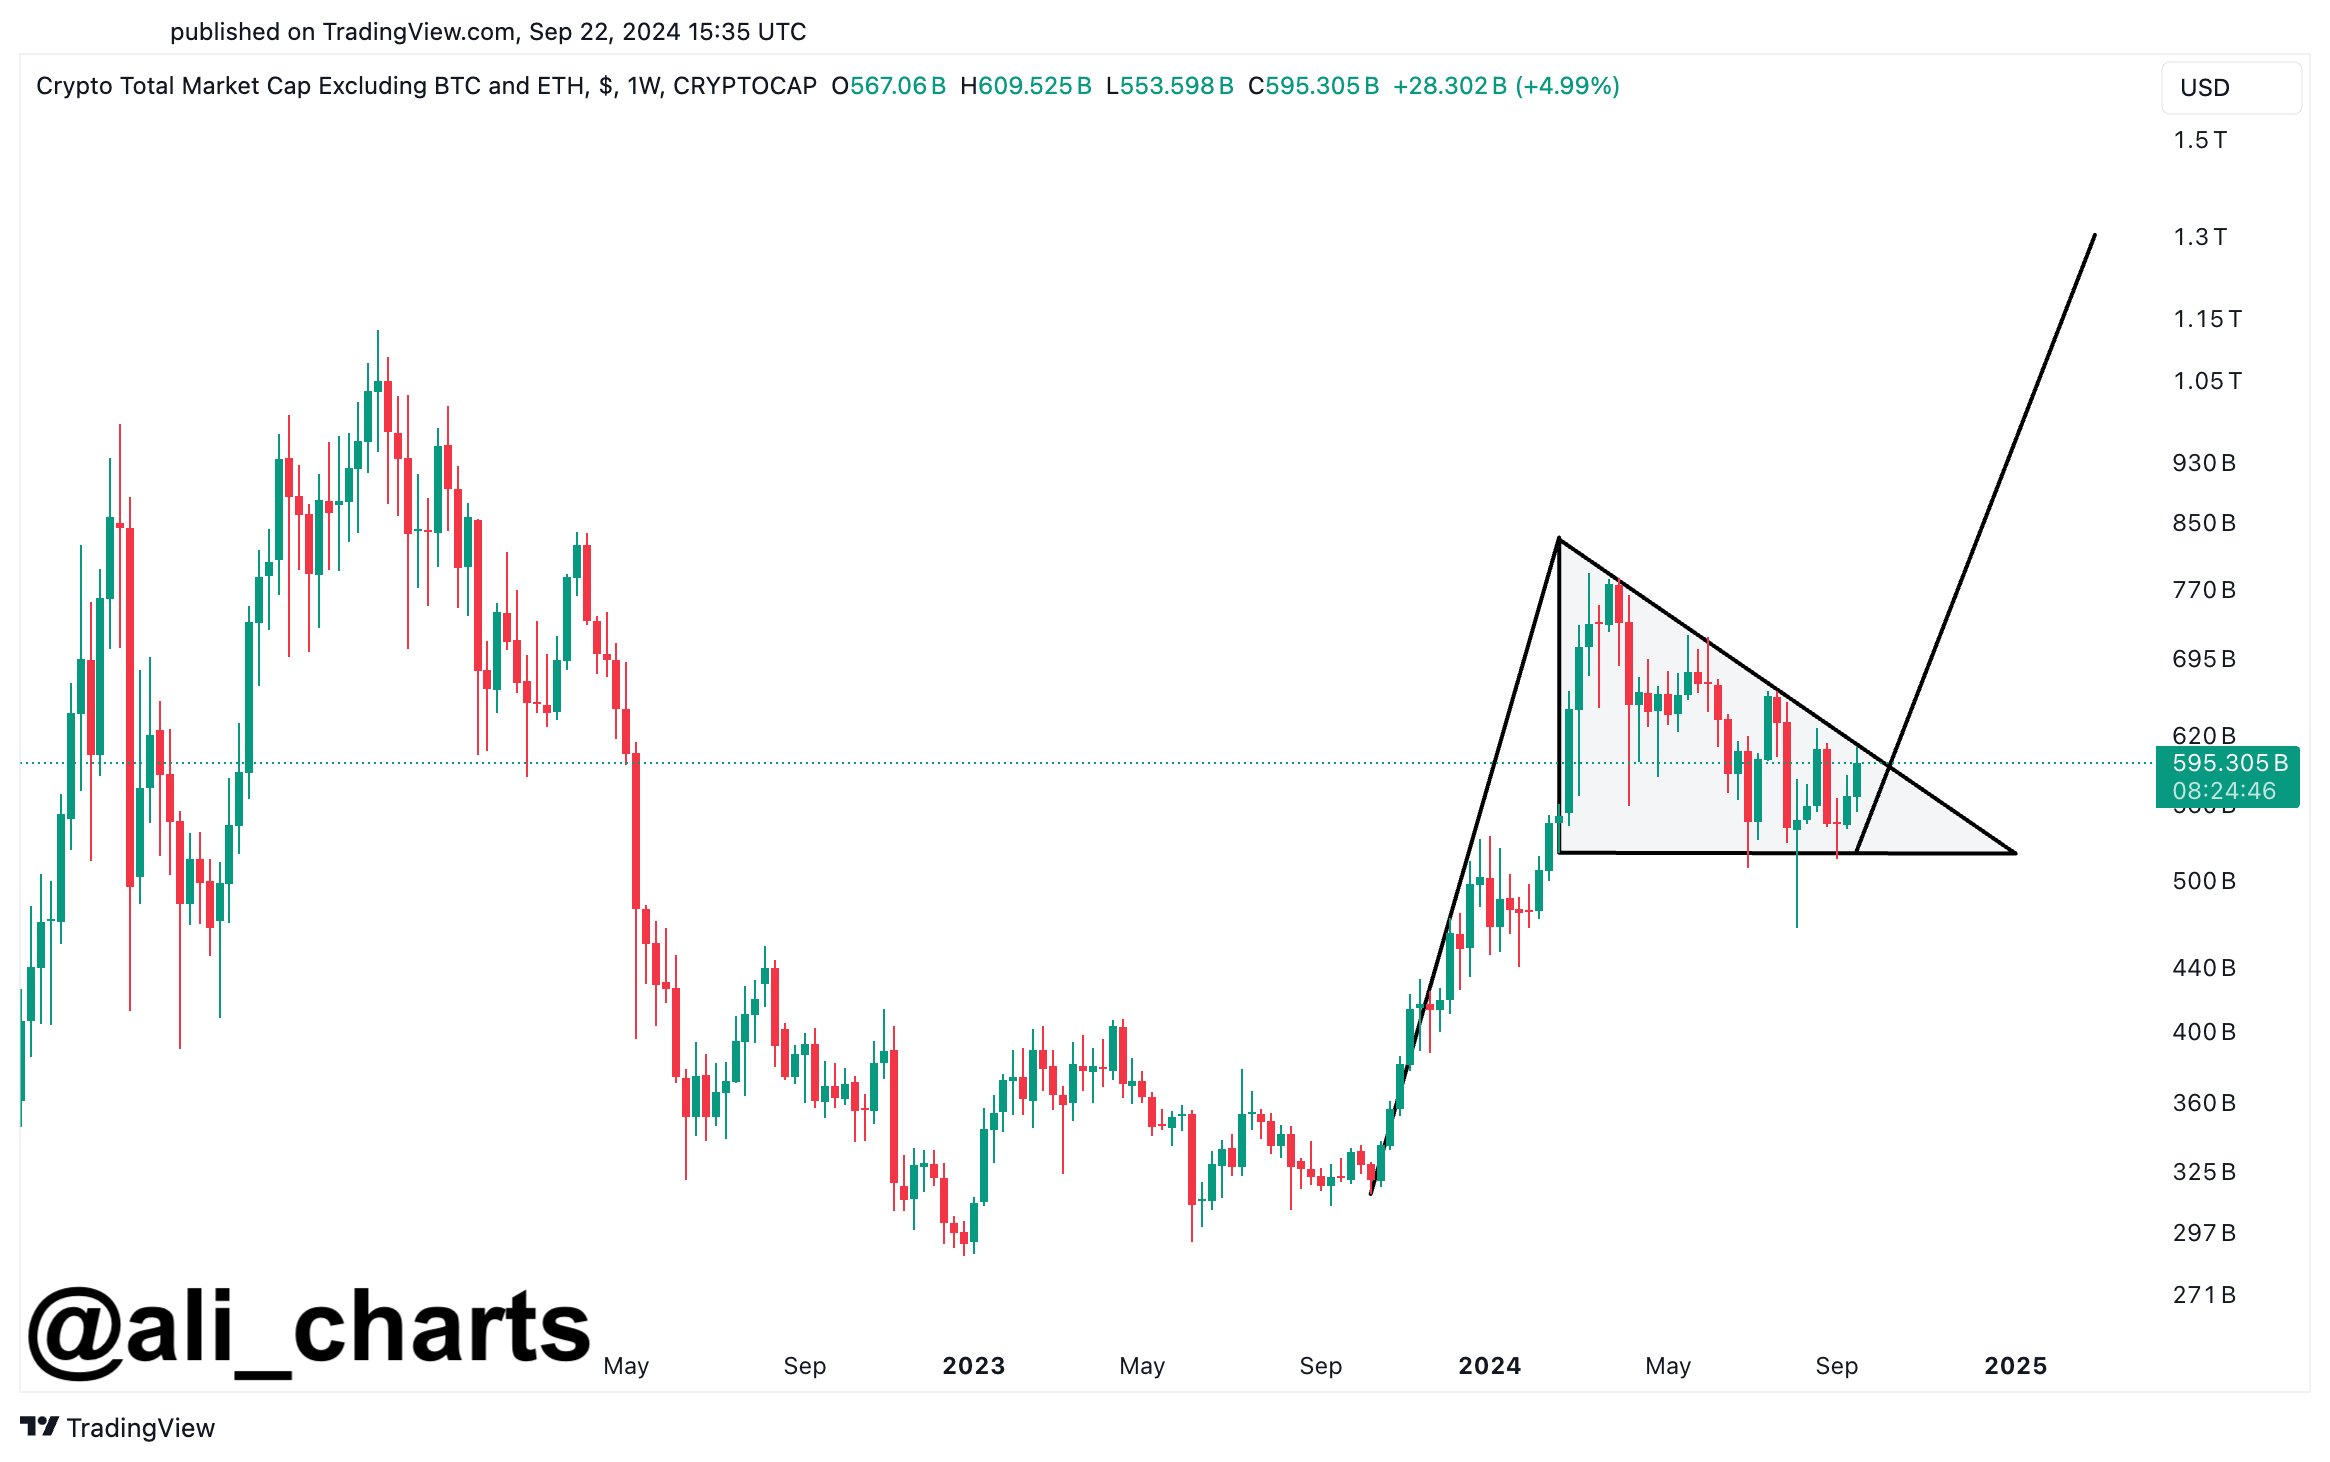
The chart shows that the total market capitalization of altcoins has been taking a swing lately. The pennant is a pattern in technical analysis (TA) with two components: a pole consisting of the prevailing trend and a triangle or ‘streamer’ representing consolidation.
In the case of the current pennant, the sharp upward trend that altcoin market capitalization saw between the fourth quarter of 2023 and the first quarter of 2024 offsets the pool portion, while the downward trend since then matches the pennant. This type of pennant is popularly called a bull pennant.
As the chart shows, the altcoin market cap recently tested the pennant’s upper channel again. It could see a significant rally if it manages to break the resistance this time.
Pennant breakouts could be the same length as the pole, so Martinez notes that the altcoin market cap could eventually cross the $1 trillion mark. This would of course only be the case if there was a break. However, the analyst sounds optimistic, saying “it’s only a matter of time before #altcoinseason!”
The second chart that could indicate the arrival of an altcoin season is Bitcoin’s market cap dominance. “Market cap” here refers to the percentage of the total cryptocurrency market cap that BTC takes into account.
Here is the chart for this metric shared by Martinez, showing the pattern that has recently formed in its value:

Bitcoin market cap dominance appears to be in a rising wedge pattern lately. The rising wedge is another TA pattern, but unlike the bull pennant that forms in the altcoin market cap, this formation is considered bearish.
In a rising wedge, the asset’s price moves upward between converging trend lines, with the movement narrowing as it approaches the top. As visible in the chart, Bitcoin market cap dominance is near the end of the rising wedge, indicating that a break below the lower channel may occur soon.
The metric is valued at 57%, but the analyst notes that this bearish formation could lead to a dip towards 47%, paving the way for altcoin season.
BTC price
Bitcoin’s rise has calmed down in recent days as the value has made a sideways move around the $63,500 level.