

Update – Since publication, BTC has fallen below $60,000 on the price charts.
- Bitcoin HODLers controlled 12.87 million BTC at the time of writing, shaping market cycles and identifying potential trends.
- Miners’ influence on the Bitcoin price weakened as their volume share fell to 7.4%, reducing market volatility.
Bitcoin [BTC] recently rose above $61,000 during early Asian trading hours on Wednesday, recovering from a significant price drop earlier this month.
As the leading asset in the crypto market, Bitcoin’s performance is often seen as a barometer for broader market trends.
According to InTheBlok According to data, Bitcoin HODLers – long-term investors who hold on to their assets despite market fluctuations – held 12.87 million BTC at the time of writing.
This group is known for accumulating Bitcoin during bear markets and strategically selling during bull markets.
The significant amount of Bitcoin under their control was a sign of their continued influence in shaping market trends.
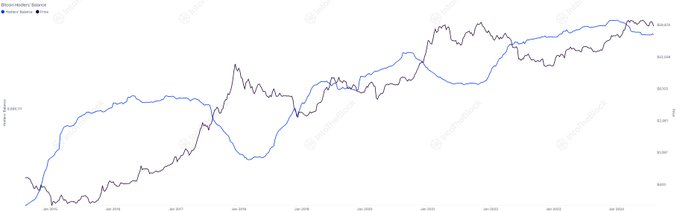
Source: IntoTheBlock
Meanwhile, the current market value to realized value ratio (MVRV) was 1.86, indicating that Bitcoin’s market value was 86% higher than its realized value.
While this indicated that Bitcoin could be slightly overvalued, it does not indicate extreme overvaluation.
Historical data shows that similar MVRV levels coincided with market peaks in 2017 and 2021, while lower MVRV ratios were observed during market bottoms in 2018 and 2022.
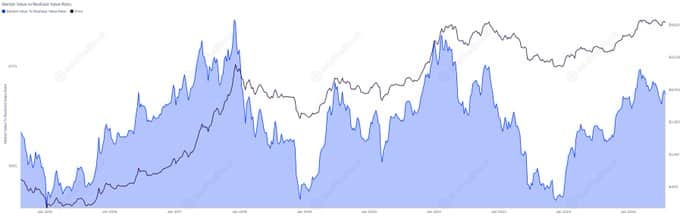
Source: IntoTheBlock
The declining market influence of miners
In August 2024, Bitcoin miners’ volume share dropped to 7.4%, marking a decline from earlier this year. This decline in miners’ share indicates that their influence on market prices has diminished.
Miners traditionally sell portions of their mined Bitcoin to cover operational costs, and lower sales volume can contribute to market stability.
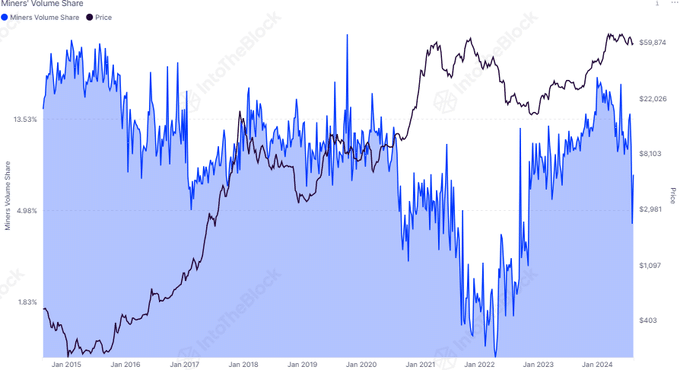
Source: IntoTheBlock
This trend of reduced selling pressure from miners suggested a possible easing of supply-side constraints on Bitcoin’s price.
With miners selling less, the market may experience less volatility, providing a more stable environment for traders and investors.
Market sentiment and network activity
Furthermore, 81% of Bitcoin addresses were profitable at the time of writing, reflecting strong market sentiment. However, this percentage is subject to change, which illustrates the cyclical nature of the market.
The Bollinger Bands, a technical indicator used to measure market volatility, are narrowing, signaling a phase of reduced volatility and potential price consolidation.
The Chaikin Money Flow (CMF), which measures buying and selling pressure, is slightly negative at -0.02.
This indicated that selling pressure was marginally greater than buying pressure, indicating cautious market sentiment.
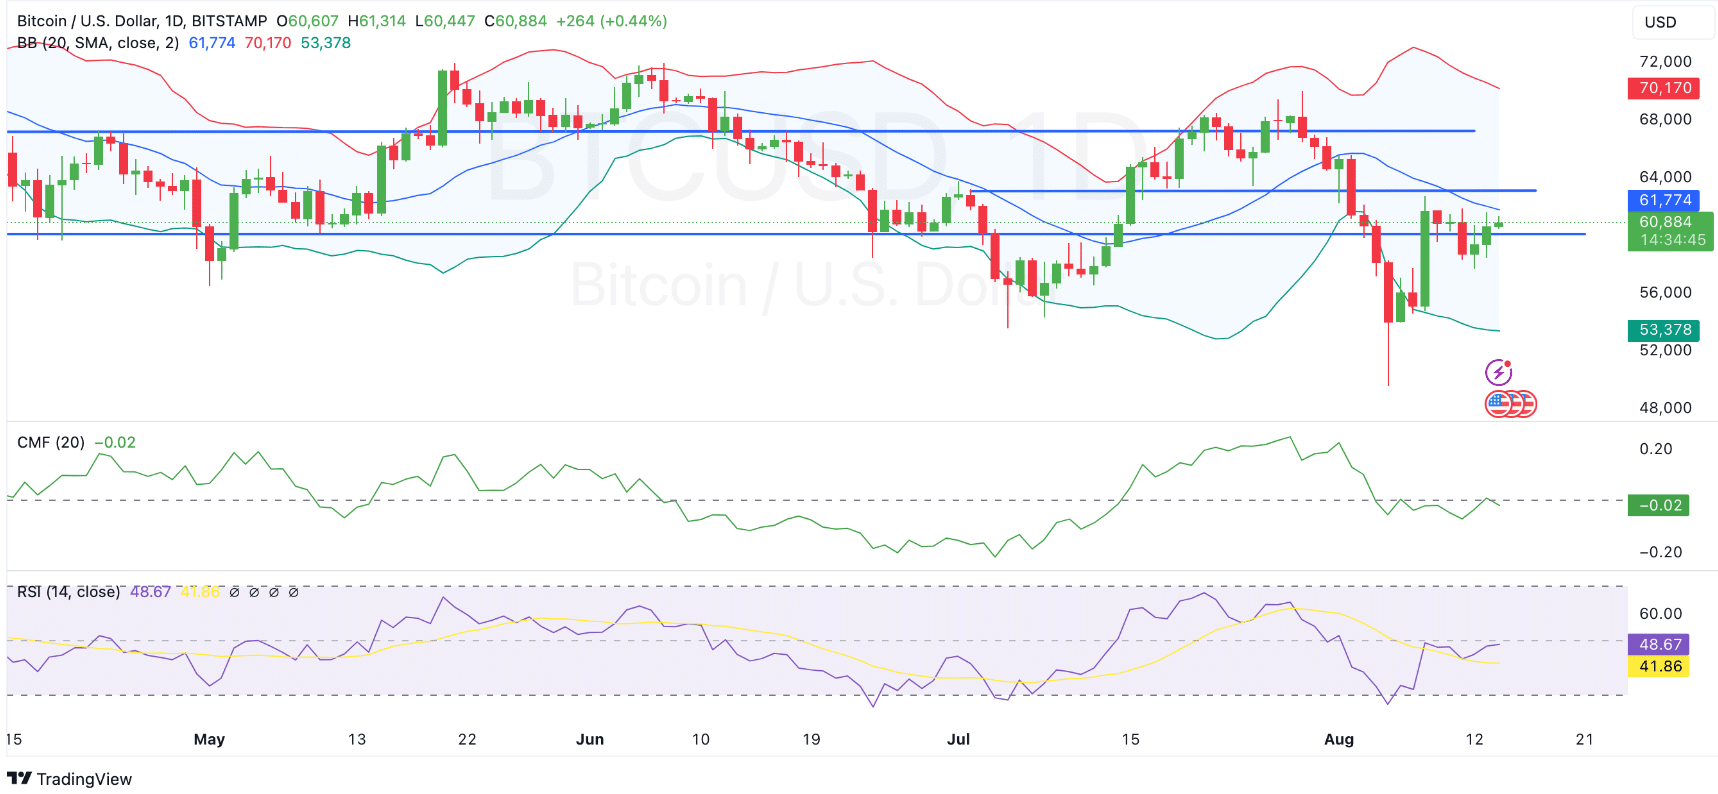
Source: TradingView
At the time of writing, the Relative Strength Index (RSI) stood at 48.66, just below the neutral level of 50, indicating neither overbought nor oversold conditions.
The recent trends of the RSI indicate a potential recovery if positive momentum builds.
Bitcoin network activity also remained stable, although it was down slightly from peak levels earlier this year.
The number of active addresses was 690.41k, reflecting consistent user engagement, while the number of transactions was 117.89k.
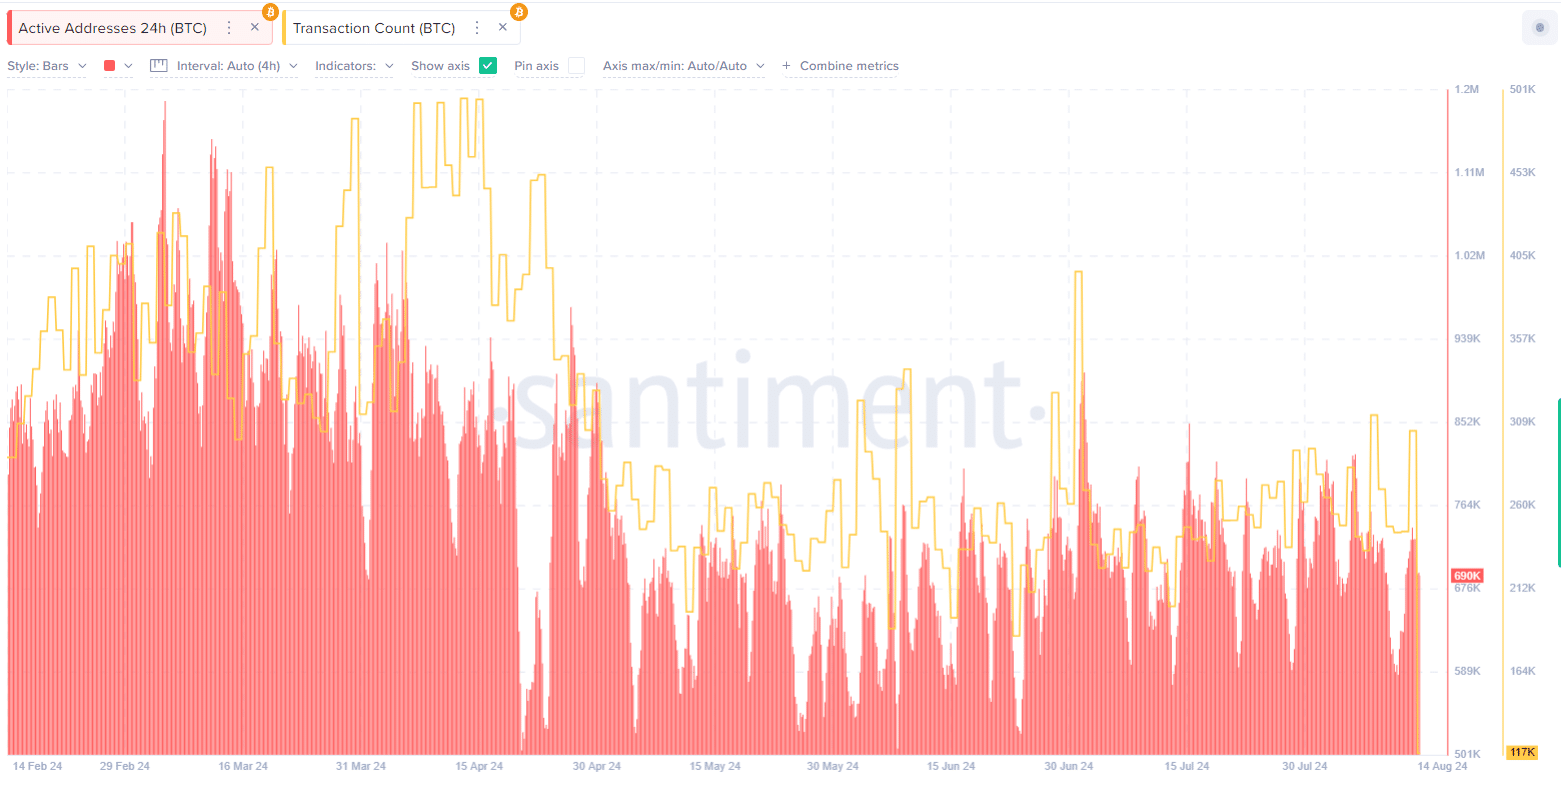
Source: Santiment
Is your portfolio green? Check out the BTC profit calculator
Despite the decline from previous highs, the number of transactions appears to be stabilizing, indicating continued, albeit reduced, activity on the network.
This stable level of activity is crucial for maintaining the overall health and functionality of the network.