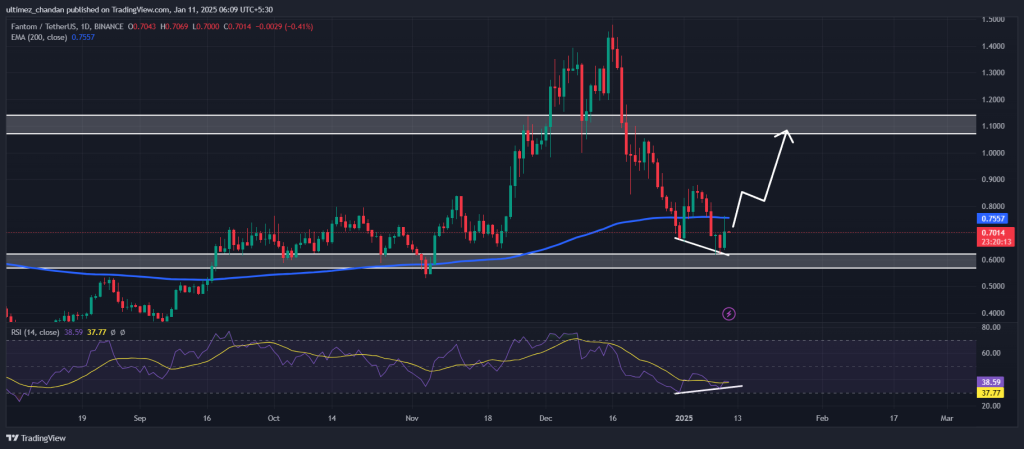
FTM, Fantom’s native token, is poised for massive upside momentum as it has formed a bullish price action pattern on its daily time frame. Despite experiencing a price drop of over 56% during the recent decline, it appears that this downward trend is reversing.
Fantom (FTM) technical analysis and upcoming levels
According to CoinPedia’s technical analysis, Fantom (FTM) has found crucial horizontal support at the USD 0.60 level. Since September 2024, the token has risen from this level several times and has experienced upward momentum. However, this time, the altcoin has shown a bullish divergence on the daily chart.

Bullish divergence is a technical analysis term that occurs when the price of an asset makes lower lows while a technical indicator, such as the Relative Strength Index (RSI), makes higher lows. Traders and investors often view bullish divergence as a potential signal to buy in anticipation of a price rise or reversal.
FTM price prediction
Based on the recent price action, if FTM holds the crucial support at the USD 0.60 level, it is very likely to rise by 50% to reach the USD 1.05 mark going forward.
Currently trading around the $0.70 level, FTM is showing signs of recovery, with the stock up more than 9.5% in the last 24 hours. Looking at this price recovery, trader and investor participation continues to skyrocket. Data from CoinMarketCap shows that FTM trading volume increased by 26% over the same period.
73.7% of traders are long on FTM
Looking at this bullish outlook, traders appear to be betting heavily on the altcoin, as evidenced by the on-chain analytics firm Mint glass. Currently, the FTM Long/Short ratio stands at 2.80, indicating strong bullish market sentiment among traders.

Data also shows that 73.7% of top traders currently hold long positions, while 26.3% hold short positions.
When these on-chain metrics are combined with technical analysis, it appears that the bulls are back in support of the FTM and could help it reach the forecast target.

