

- Ethereum network activity has declined in recent months
- The price fell by 6%, but there may be chances of a trend reversal on the charts
As the broader crypto market remains bearish, Ethereum [ETH] experienced another setback. The latest development came from blockchain network activity, when a key metric hit a record low. Let’s see what’s going on with the king of altcoins.
A look at Ethereum network activity
IntoTheBlock recently released a tweet highlighting this crucial update. According to the tweet, Ethereum costs hit a nine-month low of $18.2 million. Moreover, the blockchain gas cost also dropped to just 1 gwei. Still, it is interesting to note that despite the drop in fees, blockchain revenues remained high.
AMBCrypto’s observation of Token Terminal data showed that ETH topped the list of cryptos in terms of revenue over the past six months. In addition to ETH, Tron and MakerDAO reached the top three on the same list.
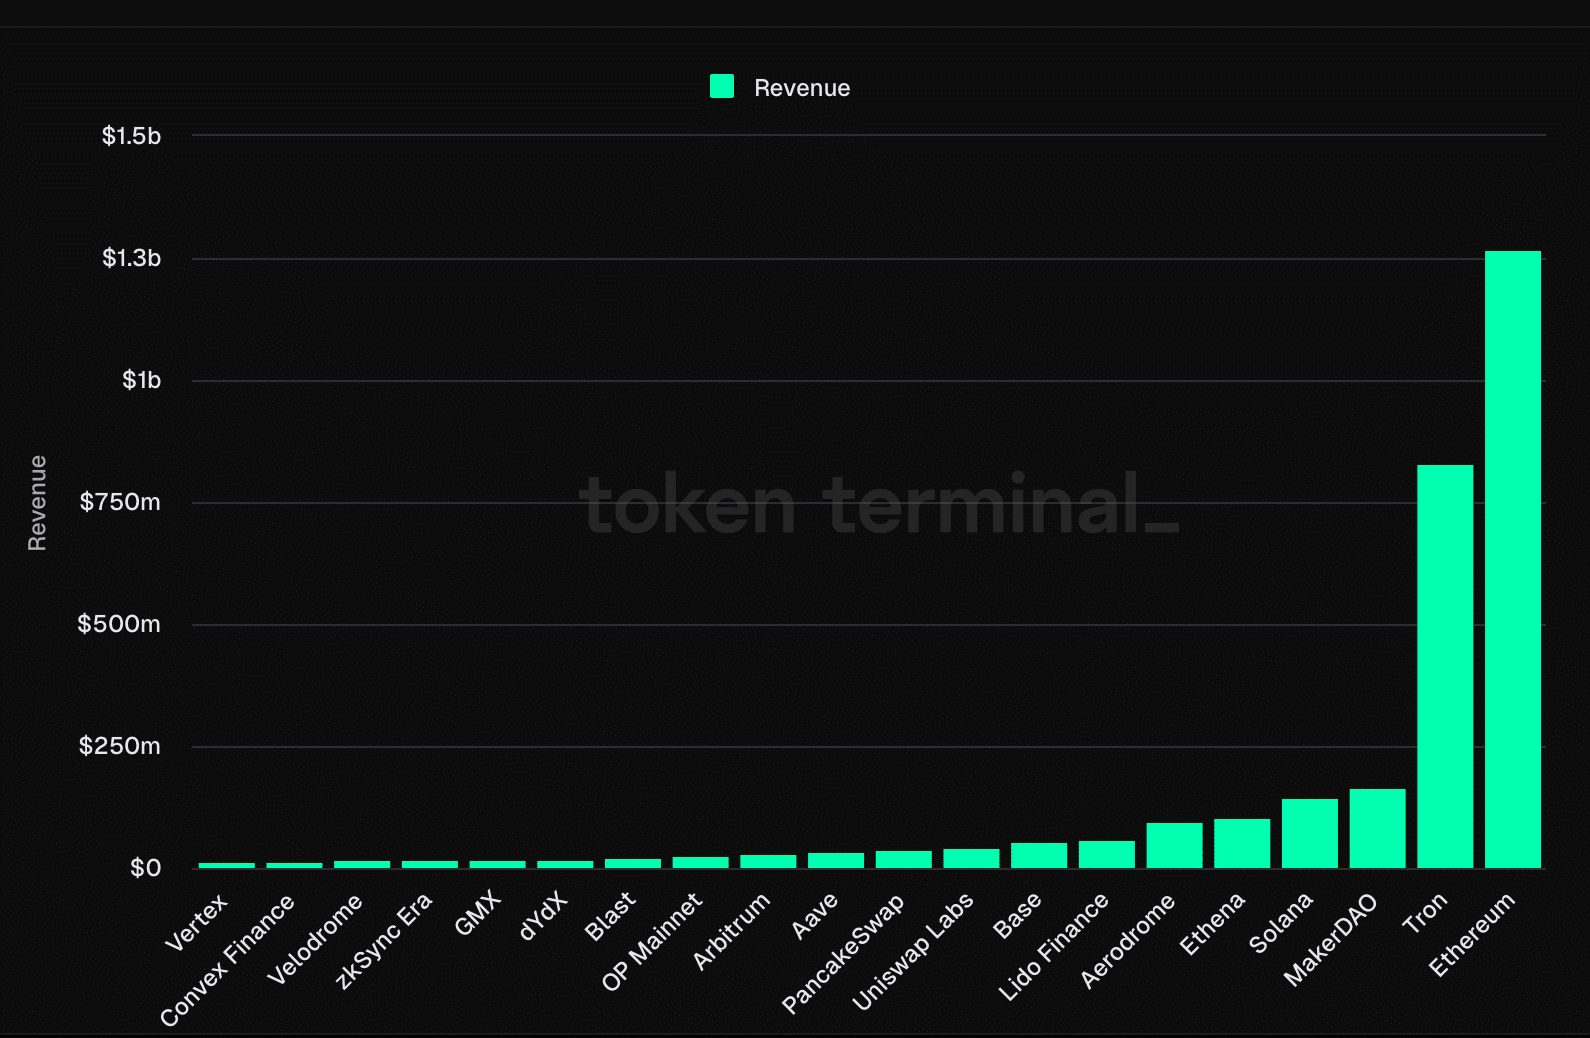
Source: Token terminal
We then checked Artemis’ data to better understand Ethereum’s network activity.
We found that ETH’s daily active addresses have dropped significantly over the past three months. Thanks to the same, the blockchain’s daily transactions also witnessed a slight decline during the same period. To date, ETH has processed over 2.44 billion transactions with an average TPS of 14.
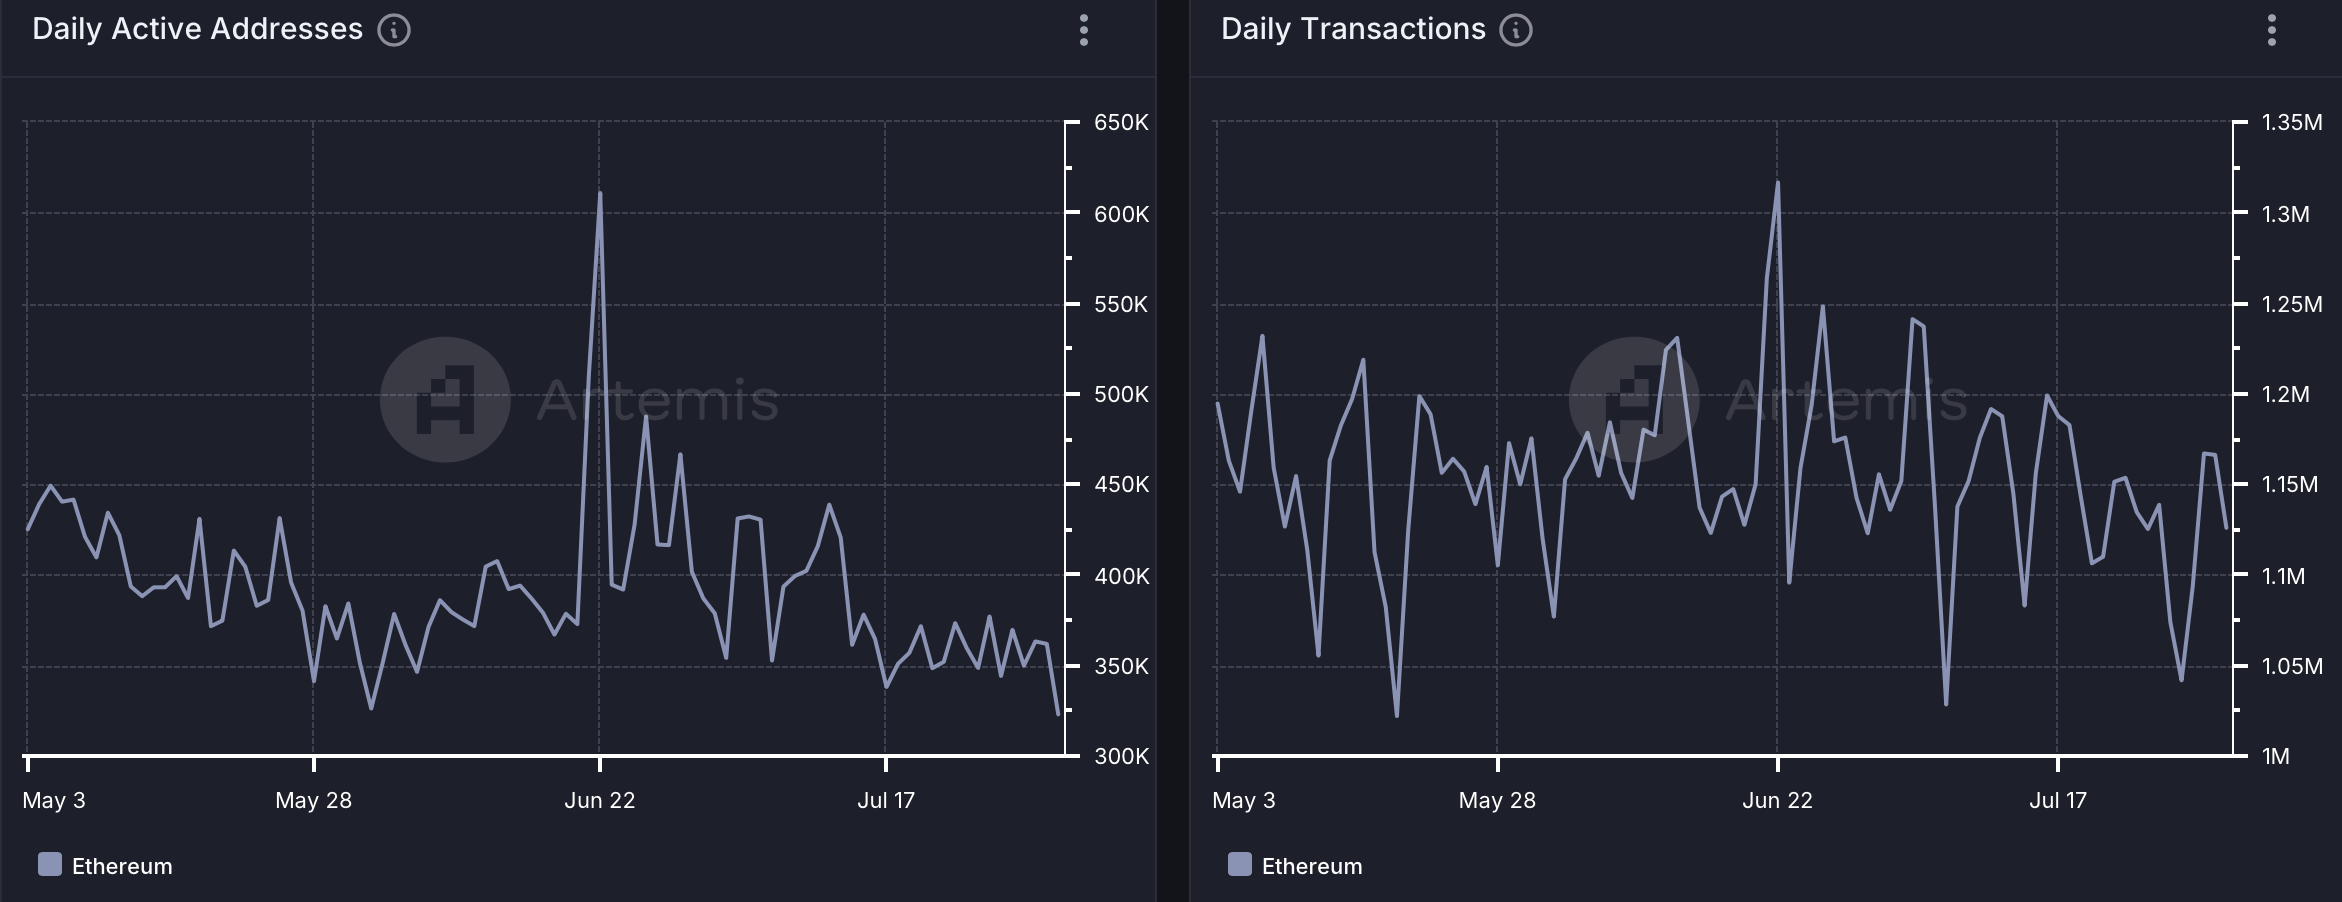
Source: Artemis
ETH bears are here
In the meantime, the market bears geared up and pushed the price of the token down the charts. According to CoinMarketCapETH’s price lost more than 9% of its value over the past seven days. In the last 24 hours alone, the altcoin fell 6%.
However, the trend can change quickly. Lookonchain recently revealed that a smart money with a 100% positive track record bought ETH, indicating that there are chances of a price increase soon.
AMBCrypto’s analysis of Glassnode’s data suggested that Ethereum’s NVT ratio also fell. A decline in this measure means an asset is undervalued – a sign that the potential for a price increase could be high.
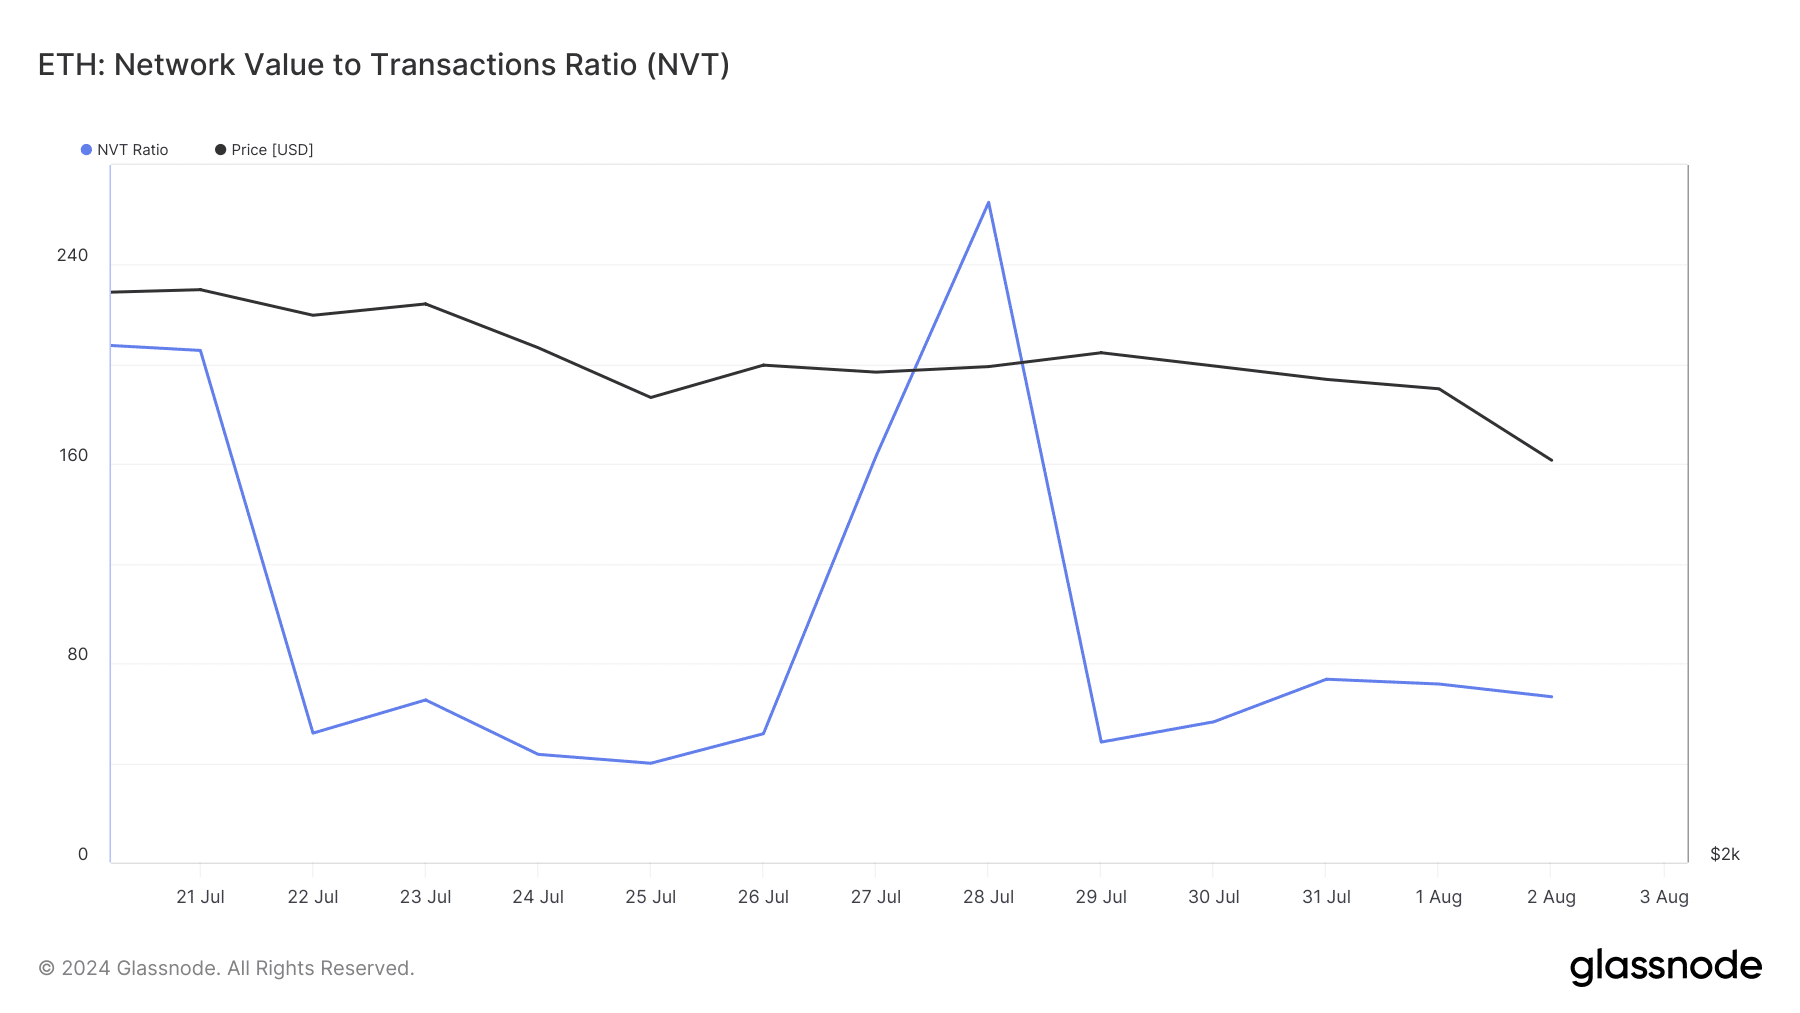
Source: Glassnode
Finally, Ethereum’s whale vs. retail delta had a value of 3 at the time of writing. To start, this metric is used to identify large differences between the retail long percentage and the whale long percentage. This indicator ranges from -100 to 100, with 0 representing whales and retail positioned exactly the same.
Is your portfolio green? look at the ETH profit calculator
Since it had a value of 3 at the time of writing, this meant that there were more whale positions – a sign that deep-pocketed players in the market were quite confident in the token.
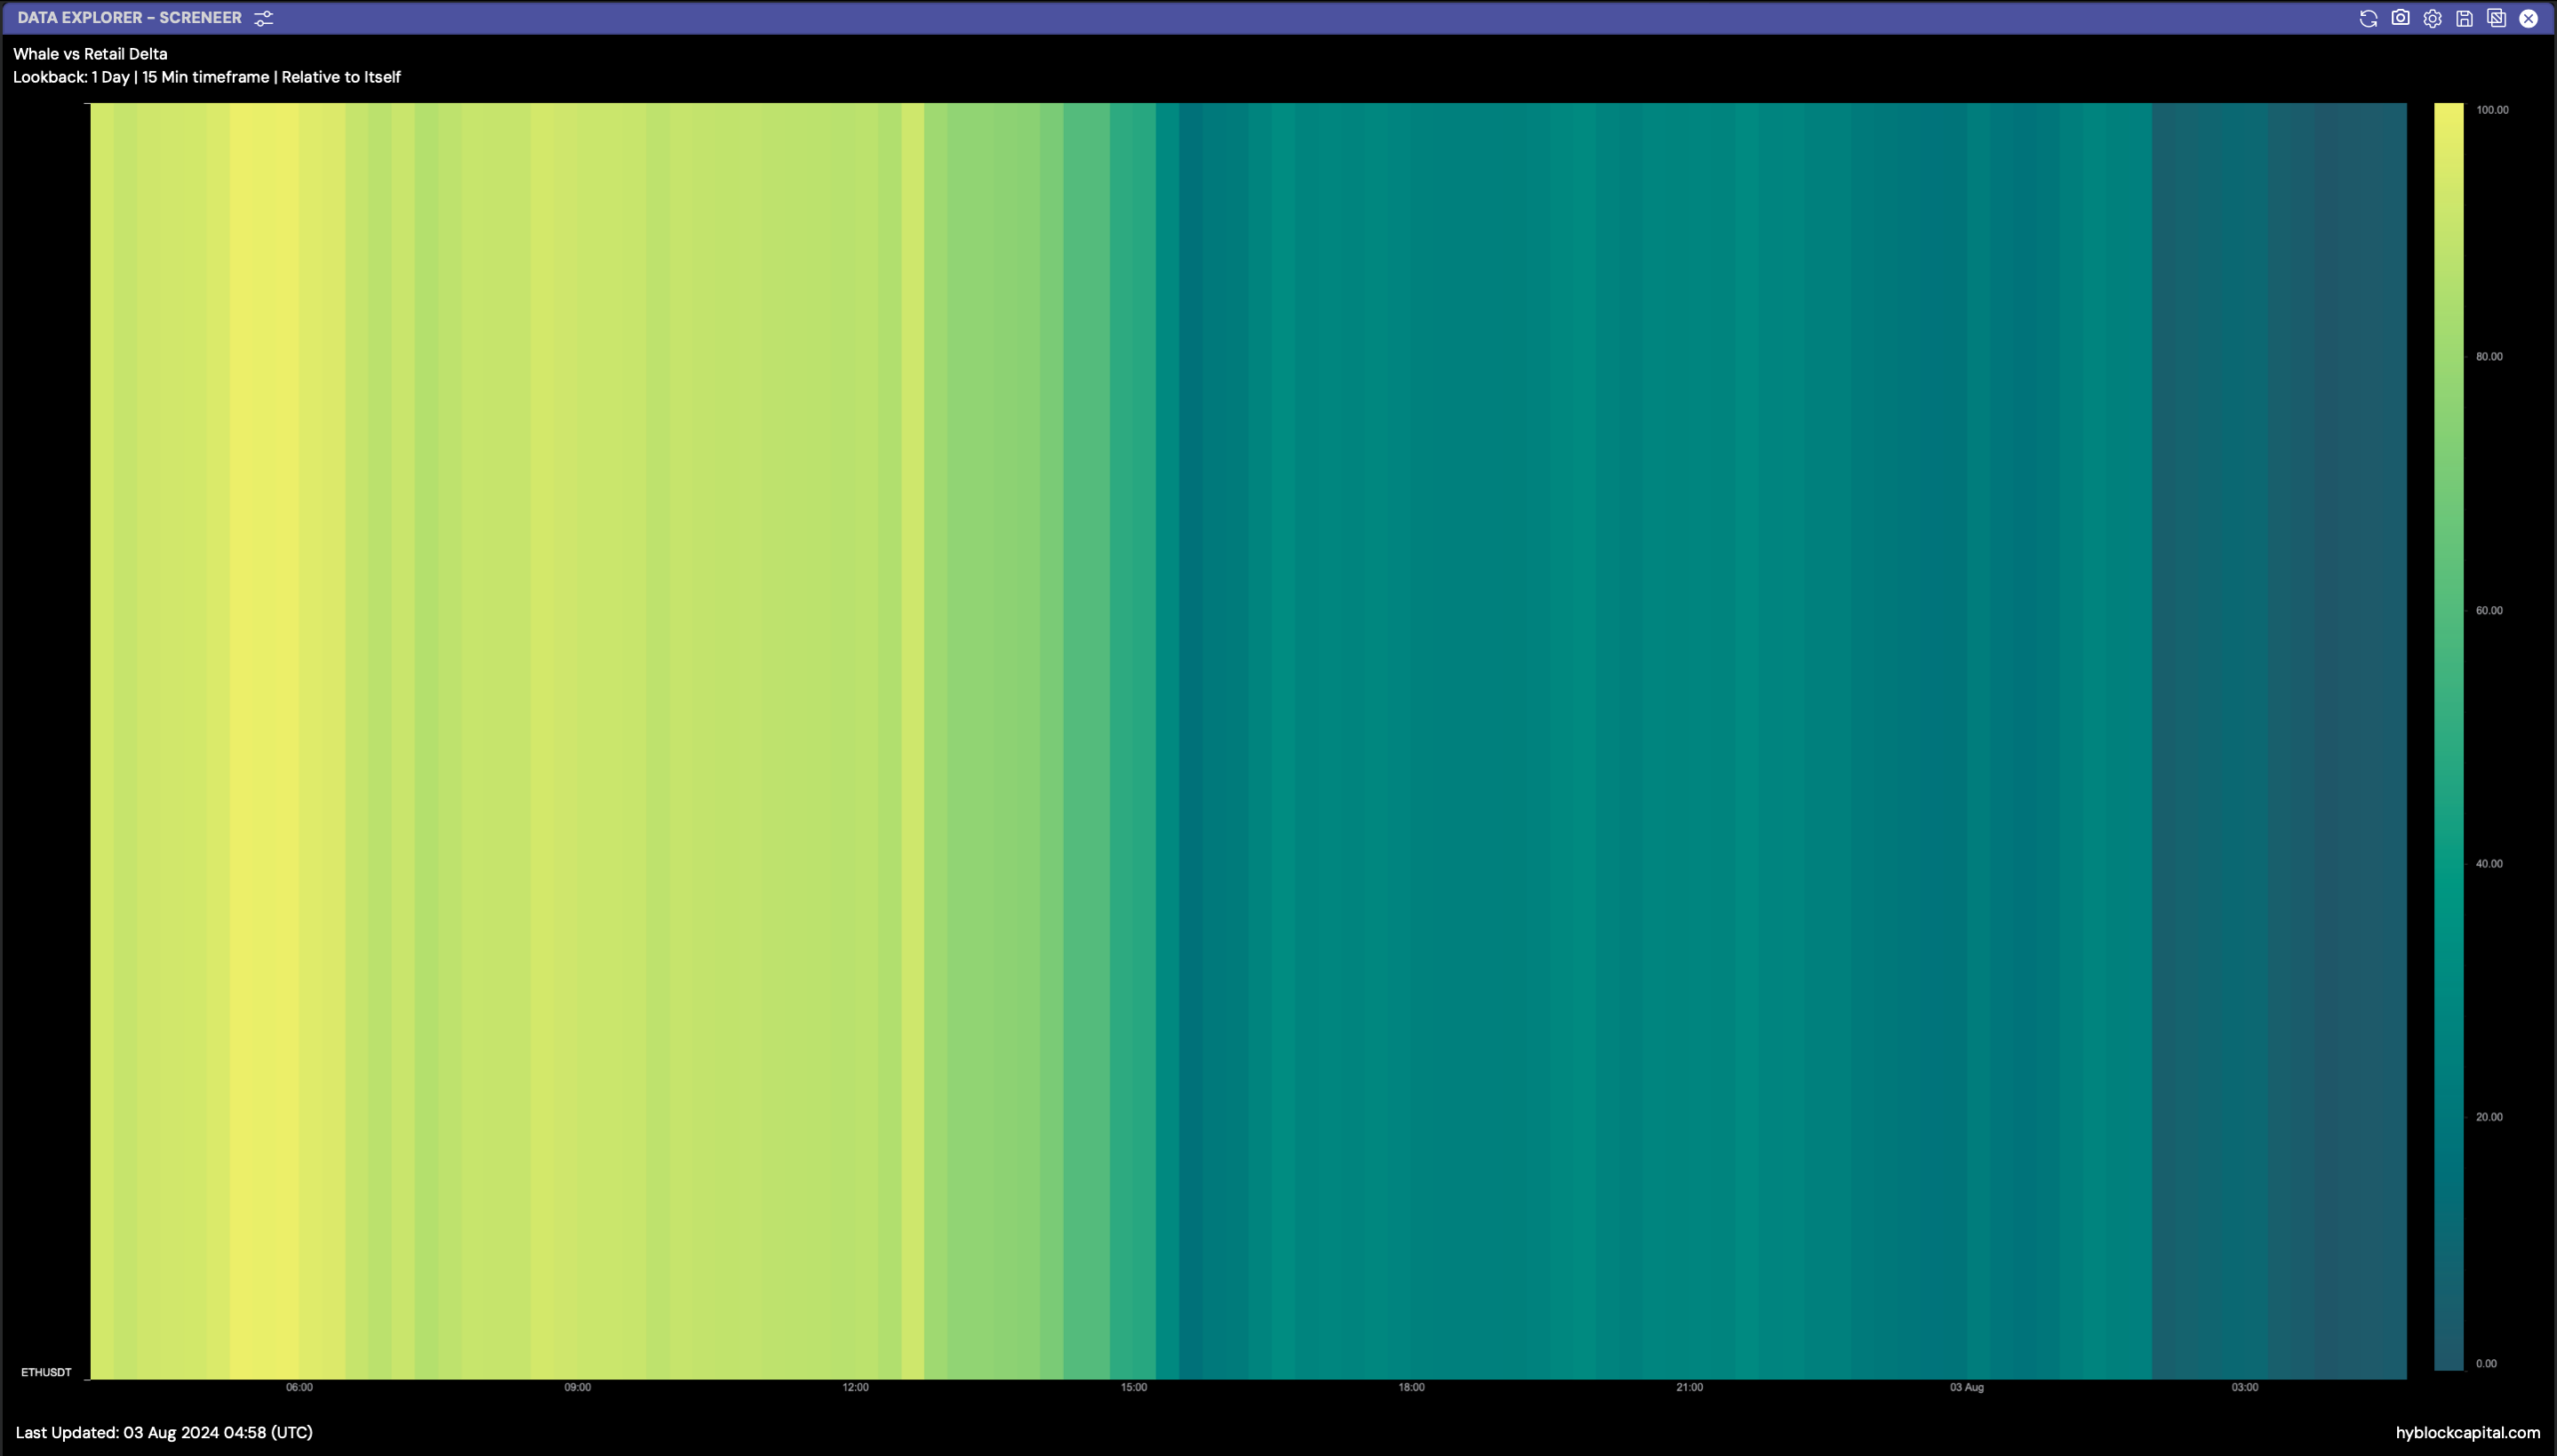
Source: Hyblock Capital