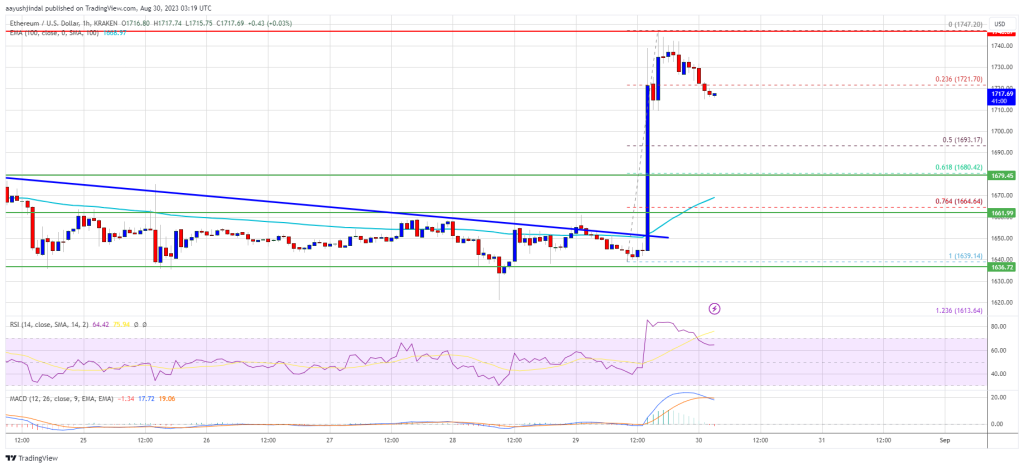
Ethereum price surged above the USD 1,700 resistance against the US dollar. ETH struggled near USD 1,750 and it is currently correcting gains.
- Ethereum gained momentum above the USD 1,660 and USD 1,670 levels.
- The price is trading above $1,700 and the 100-hour Simple Moving Average.
- There was a break above a key bearish trendline with resistance around $1,650 on the ETH/USD hourly chart (data feed via Kraken).
- The pair is now correcting gains from the USD 1,750 resistance.
Ethereum Price Rally Stalls
Ethereum price was able to start a decent increase from the USD 1,620 zone. ETH formed a base and started a steady rise above the USD 1,650 resistance, as did Bitcoin.
There was a break above a key bearish trendline with resistance near $1,650 on the ETH/USD hourly chart. The pair climbed above the USD 1,670 and USD 1,700 resistance levels. However, the bears were active near the USD 1,750 zone.
A high is forming near USD 1,747 and the price is now correcting gains. There was a move below the USD 1,720 level. The price fell below the 23.6% Fib retracement level of the upward move from the $1,639 swing low to the $1,747 high.
Ether is now trading above $1,700 and the 100-hour Simple Moving Average. On the upside, the price could encounter resistance near the USD 1,725 level. The next resistance is near the USD 1,750 level.

A close above the USD 1,750 level could push the price towards the USD 1,850 zone. If there is a clear move above USD 1,850, Ethereum could rise towards the USD 1,920 resistance. Any further gains could push the price towards the USD 2,000 resistance.
Are dips supported in ETH?
If Ethereum fails to clear the USD 1,750 resistance, it could continue to decline. The initial downside support is near the USD 1,700 level. The first major support is close to USD 1,680 or the 61.8% Fib retracement level of the upward move from the USD 1,639 swing low to the USD 1,747 high.
The next major support is near the USD 1,660 level. If there is a downside break below USD 1,660, the price could accelerate towards the USD 1,620 level. Any further losses could send the price towards the USD 1,540 level in the near term.
Technical indicators
MACD per hour – The MACD for ETH/USD is losing momentum in the bullish zone.
RSI per hour – The RSI for ETH/USD is now above the 50 level.
Major Support Level – $1,680
Major resistance level – $1,750

