

Ethereum price struggled to break the USD 2,750 resistance. ETH is now consolidating near $2,635 and remains at risk of more downside.
- Ethereum started a new decline from the USD 2,750 resistance.
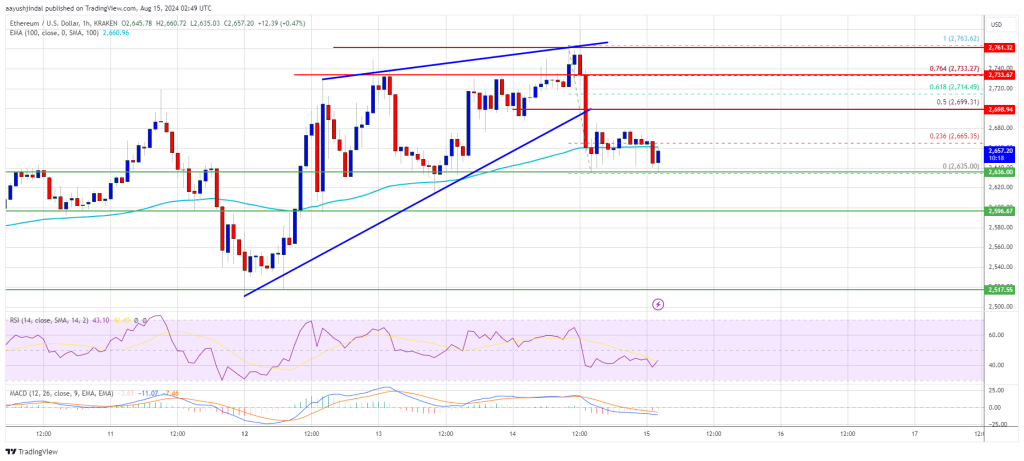
- The price is trading below $2,700 and the 100-hourly Simple Moving Average.
- There was a break below a major contracting triangle with support at $2,695 on the hourly chart of ETH/USD (data feed via Kraken).
- The pair could extend losses if it falls below the $2,635 support zone.
Ethereum price drops again
Ethereum price started a decent rise against the USD 2,650 support zone. ETH outperformed Bitcoin and surpassed the USD 2,720 resistance zone. However, the bears were active near the $2,750 zone.
The recent swing high was formed at $2,763 before the price corrected gains. There was a move below the USD 2,720 and USD 2,700 levels. Additionally, there was a break below a key contracting triangle with support at $2,695 on the hourly chart of ETH/USD.
The Ethereum price is now trading below $2,700 and the 100-hourly Simple Moving Average. A low is formed near USD 2,635 and the price is now consolidating. If another rise occurs, the price may face hurdles near the USD 2,700 level. It is close to the 50% Fib retracement level of the recent decline from the $2,763 swing high to the $2,635 low.
The first major resistance is near the $2,735 level or the 76.4% Fib retracement level of the recent decline from the $2,763 swing high to the $2,635 low. A close above the USD 2,735 level could send Ether towards the USD 2,765 resistance.
The next major resistance is near USD 2,800. An upside break above the USD 2,800 resistance could send the price higher towards the USD 2,880 resistance zone in the near term.
Lose more in ETH?
If Ethereum fails to clear the USD 2,700 resistance, it could continue to decline. The initial downside support is near $2,635. The first major support is near the $2,600 zone.
A clear move below the USD 2,600 support could push the price towards USD 2,550. Any further losses could send the price towards the USD 2,520 support level in the near term. The next major support is at $2,440.
Technical indicators
hourly MACD – The MACD for ETH/USD is losing momentum in the bullish zone.
RSI per hour – The RSI for ETH/USD is now below the 50 zone.
Major support level – $2,635
Major resistance level – $2,700