

The Ethereum price started a recovery wave above $2,000. ETH is now consolidating and remains at risk of another decline below $1,980.
- Ethereum struggled to extend gains above $2,120 and corrected lower.
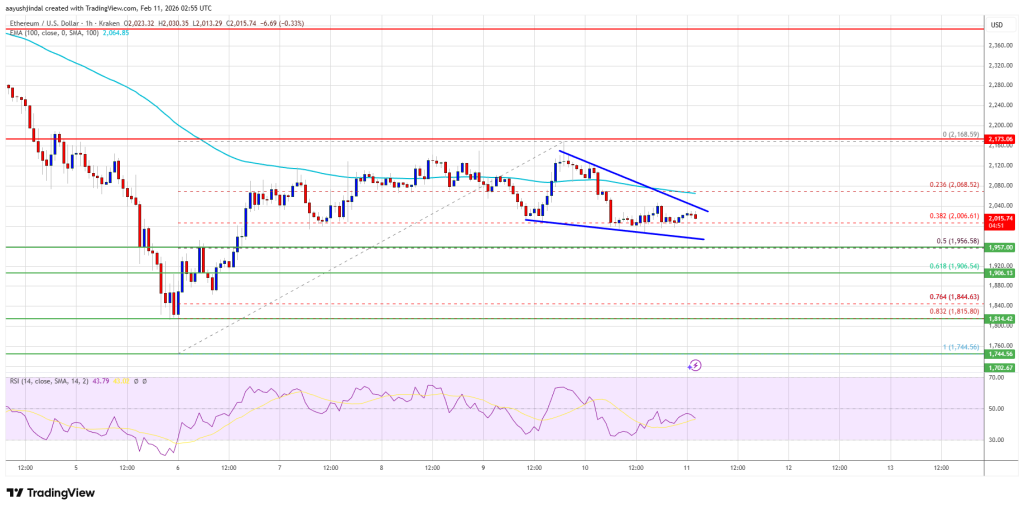
- The price is trading below $2,050 and the 100-hourly Simple Moving Average.
- A contracting triangle is forming with resistance at $2,040 on the hourly chart of ETH/USD (data feed via Kraken).
- The pair could start a new decline if it stays below the $2,120 zone.
Ethereum price drops again
The price of Ethereum managed to form a base above $1,950 and started a recovery wave, just like Bitcoin. ETH price traded above the USD 1,980 and USD 2,020 resistance levels.
The pair even peaked above $2,140. It reached a high of $2,168, and the price is now moving lower. There was a decline below $2,050. The price tested the 38.2% Fib retracement level of the upward move from the $1,745 swing low to the $2,168 high.
Ethereum price is now trading below $2,050 and the 100-hourly Simple Moving Average. If the bulls continue to act above $2,000, the price may try to rise again. Immediate resistance is seen around the $2,050 level. A contracting triangle is also forming with resistance at $2,040 on the hourly chart of ETH/USD.
The first major resistance is near the $2,065 level. The next major resistance is around the $2,120 level. A clear move above the USD 2,120 resistance could send the price towards the USD 2,165 resistance. An upside break above the $2,165 region could lead to more gains in the coming days. In the mentioned case, Ether could rise towards the USD 2,250 or even USD 2,280 resistance zone in the short term.
Another drop in ETH?
If Ethereum fails to clear the USD 2,065 resistance, it could trigger another decline. The initial downside support is near the $2,000 level. The first major support is near the $1,950 zone or the 50% Fib retracement level of the upward move from the $1,745 swing low to the $2,168 high.
A clear move below the USD 1,950 support could push the price towards the USD 1,900 support. Any further losses could send the price towards $1,850. The main support could be at USD 1,820.
Technical indicators
hourly MACD – The MACD for ETH/USD is gaining strength in the bearish zone.
RSI per hour – The RSI for ETH/USD is now below the 50 zone.
Major Support Level – $2,000
Major resistance level – $2,065