

Ethereum’s price rose more than 5% and there was momentum towards $2,700. ETH is consolidating gains and could aim for a move towards $2,800 or $3,000.
- Ethereum is consolidating gains below the USD 2,700 resistance zone.
- The price is trading above $2,600 and the 100-hourly Simple Moving Average.
- There was a break above a bullish flag pattern with resistance at $2,500 on the hourly chart of ETH/USD (data feed via Kraken).
- The pair could start a new rise if it remains above the $2,630 support zone.
Ethereum Price Begins New Rise
Ethereum price remained steady above the USD 2,420 resistance. ETH formed a base and started a new rise above the $2,500 resistance, outperforming Bitcoin.
There was a break above a bullish flag pattern with resistance at $2,500 on the hourly chart of ETH/USD. The pair gained over 5% and there was a clear move above the $2,600 resistance. It even went towards the USD 2,700 level. It made a high near USD 2,681 and the price is now consolidating gains.
There was a small decline below the USD 2,660 level. Ethereum is still trading above the 23.6% Fib retracement level from the recent rally from the $2,472 swing low to the $2,681 high. It is also trading above $2,620 and the 100-hourly Simple Moving Average.
If a new increase occurs, the price could rise above the $2,660 level. On the upside, the first major resistance is around the $2,680 level. The next major resistance is near USD 2,720, above which the price could rise and test the USD 2,800 resistance.
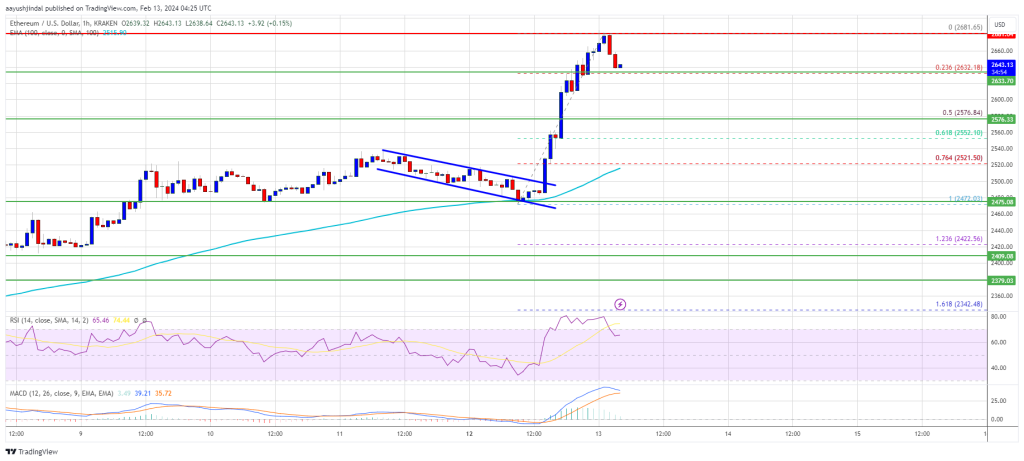
Source: ETHUSD on TradingView.com
If the bulls stay in action, they could even push the price above the USD 2,800 resistance. In the said case, the price could rise to the $3,000 level.
Are dips limited in ETH?
If Ethereum fails to clear the USD 2,680 resistance, it could initiate a downward correction. The initial downside support is near the $2,630 level.
The next major support could be the $2,600 zone. A clear move below the $2,600 support could send the price towards $2,575 or the 50% Fib retracement level of the recent rally, from the $2,472 swing low to the $2,681 high. The key support could be $2,520 or the 100 hourly SMA. Any further losses could send the price towards the USD 2,400 level.
Technical indicators
hourly MACD – The MACD for ETH/USD is losing momentum in the bullish zone.
RSI per hour – The RSI for ETH/USD is now above the 50 level.
Major support level – $2,630
Major resistance level – $2,680
Disclaimer: The article is for educational purposes only. It does not represent NewsBTC’s views on buying, selling or holding investments and of course investing involves risks. You are advised to conduct your own research before making any investment decisions. Use the information on this website entirely at your own risk.