

Ethereum price extended its decline below USD 2,200 and USD 2,120. ETH is now trying to recover from USD 2,075 but faces many hurdles near USD 2,220.
- Ethereum failed to stay above $2,250 and started a new decline.
- The price is trading below $2,200 and the 100-hourly Simple Moving Average.
- A major bearish trendline is forming with resistance at $2,255 on the hourly chart of ETH/USD (data feed via Kraken).
- The pair could start a new decline if it stays below the $2,320 zone.
Ethereum price continues to fall
Ethereum’s price failed to hold steady above $2,250 and extended losses, just like Bitcoin. ETH price traded below $2,200 and entered a bearish zone.
The bears even pushed the price below $2,120. A low was formed at $2,073 and the price is now trying to recover. There was a move above $2,120, but the price remained well below the 23.6% Fib retracement level of the downward move from the $3,040 swing high to the $2,073 low.
The Ethereum price is now trading below $2,200 and the 100-hourly Simple Moving Average. There is also a major bearish trendline forming with resistance at $2,255 on the hourly chart of ETH/USD.
If the bulls continue to act above $2,100, the price could rise again. Immediate resistance is seen around the $2,200 level. The first major resistance is near the $2,250 level and trendline. The next major resistance is around the $2,390 level.
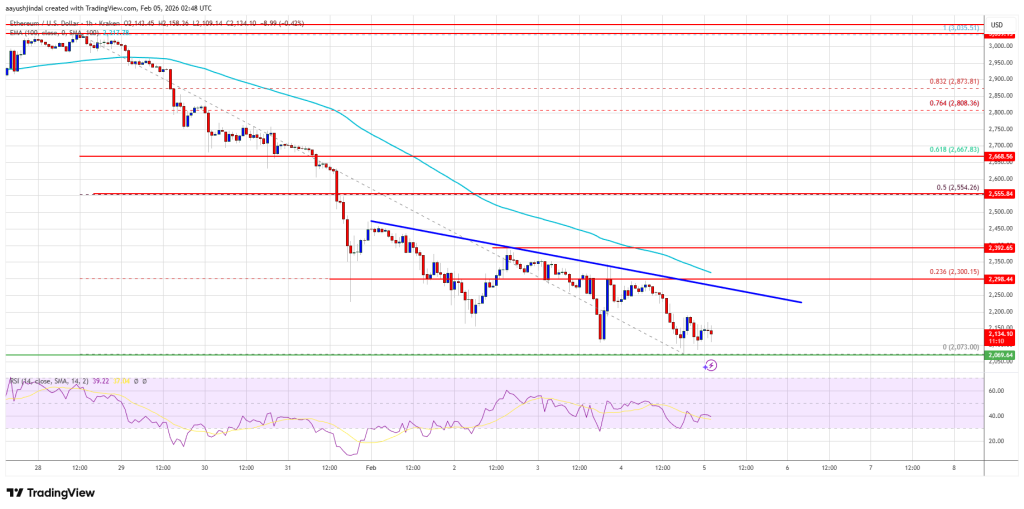
A clear move above the $2,390 resistance could send the price towards the $2,550 resistance or towards the 50% Fib retracement level of the downward move from the $3,040 swing high to the $2,073 low. An upside break above the $2,550 region could call for more gains in the coming days. In the mentioned case, Ether could rise towards the USD 2,650 or even USD 2,665 resistance zone in the short term.
Lose more in ETH?
If Ethereum fails to clear the USD 2,250 resistance, it could trigger another decline. The initial downside support is near the $2,100 level. The first major support is near the $2,075 zone.
A clear move below the USD 2,075 support could push the price towards the USD 2,050 support. Any further losses could send the price towards $2,000. The main support could be at USD 1,880.
Technical indicators
hourly MACD – The MACD for ETH/USD is gaining strength in the bearish zone.
RSI per hour – The RSI for ETH/USD is now below the 50 zone.
Major support level – $2,075
Major resistance level – $2,250