

Ethereum price started a recovery wave above $2,850. ETH is facing resistance around $3,000 and could start a new decline in the near term.
- Ethereum started a recovery wave above USD 2,800 and USD 2,850.
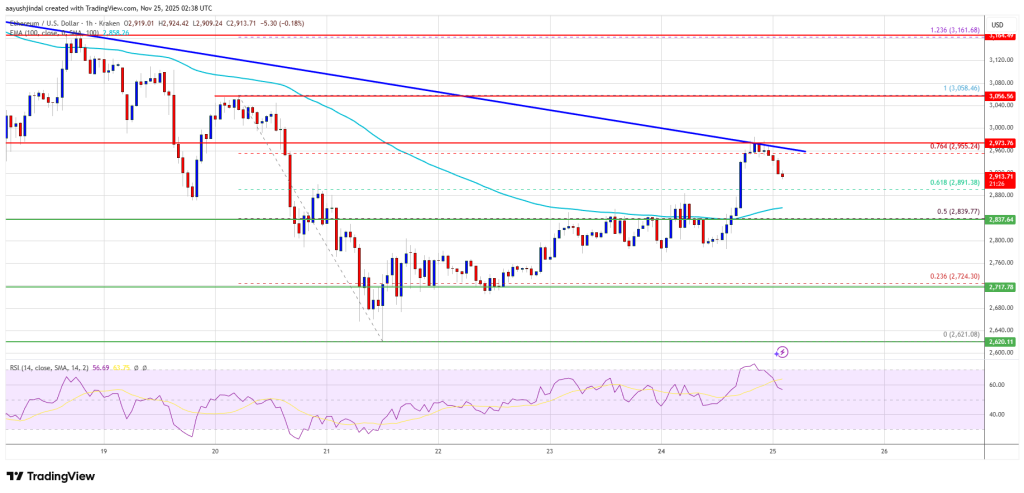
- The price is trading above USD 2,850 and the 100-hourly Simple Moving Average.
- A major bearish trendline is forming with resistance at $2,970 on the hourly chart of ETH/USD (data feed via Kraken).
- The pair could continue to decline if it crosses below the $2,840 zone.
Ethereum price faces resistance
Ethereum’s price managed to stay above $2,650 and started a recovery wave, just like Bitcoin. ETH price was able to rise above the USD 2,740 and USD 2,800 levels.
The bulls were able to push the price above the 50% Fib retracement level of the downward move from the $3,058 swing high to the $2,620 low. However, the bears seem to be active below the USD 3,000 resistance zone. There is also a major bearish trendline forming with resistance at $2,970 on the hourly chart of ETH/USD.
Ethereum price is now trading above $2,840 and the 100-hourly Simple Moving Average. If another recovery wave comes, the price may face resistance near the $2,950 level and the 76.4% Fib retracement level of the downward move from the $3,058 swing high to the $2,620 low.
The next major resistance is near the $2,970 level. The first major resistance is around the $3,000 level. A clear move above the USD 3,000 resistance could send the price towards the USD 3,050 resistance. An upside break above the $3,050 region could call for more gains in the coming days. In the mentioned case, Ether could rise towards the USD 3,120 or even USD 3,250 resistance zone in the short term.
Another drop in ETH?
If Ethereum fails to clear the USD 2,950 resistance, it could trigger another decline. The initial downside support is near the $2,840 level. The first major support is near the $2,780 zone.
A clear move below the USD 2,780 support could push the price towards the USD 2,740 support. Any further losses could send the price towards $2,650 in the near term. The next major support is at USD 2,550 and USD 2,500.
Technical indicators
hourly MACD – The MACD for ETH/USD is losing momentum in the bullish zone.
RSI per hour – The RSI for ETH/USD is now above the 50 zone.
Major support level – $2,800
Major resistance level – $2,950