

Ethereum price started a recovery wave from the $2,400 zone. ETH is now struggling to pace a move above the $2,600 resistance zone.
- Ethereum started a recovery wave above USD 2,500 and USD 2,550.
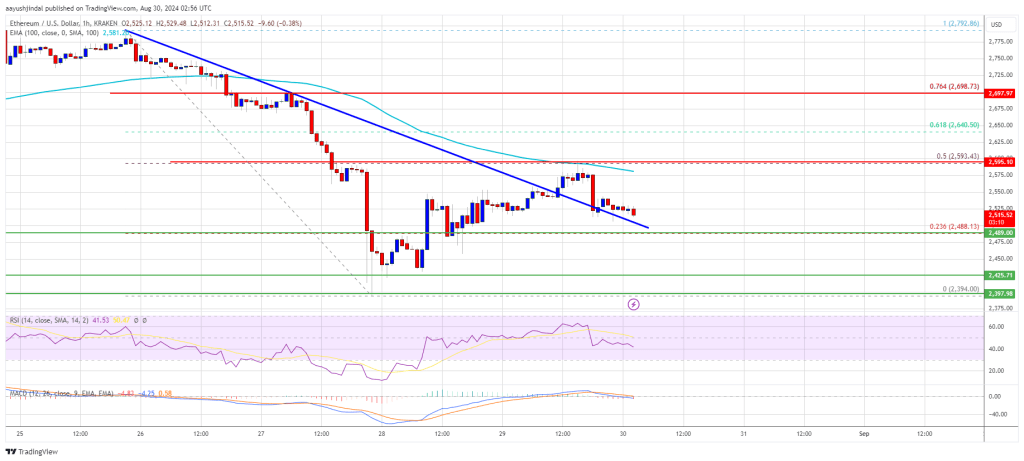
- The price is trading below $2,550 and the 100-hourly Simple Moving Average.
- There was a break above a key bearish trendline with resistance at $2,550 on the hourly chart of ETH/USD (data feed via Kraken).
- The pair needs to remain above $2,485 to rise again in the near term.
Ethereum price attempts recovery
The price of Ethereum remained stable above $2,400 and tried to make a recovery wave like Bitcoin. The price could rise above the USD 2,480 and USD 2,500 resistance levels.
There was a move above the 23.6% Fib retracement level of the downwave, from the $2,792 swing high to the $2,395 low. The price even surpassed the resistance at $2,550. There was a break above a key bearish trendline with resistance at $2,550 on the hourly chart of ETH/USD.
However, the bears were active near the USD 2,600 resistance. They protected the 50% Fib retracement level of the downside wave from the $2,792 swing high to the $2,395 low.
Ethereum price is now trading below $2,580 and the 100-hourly Simple Moving Average. On the upside, the price seems to be facing hurdles near the USD 2,550 level and the 100-hourly Simple Moving Average. The first major resistance is around the $2,600 level. A close above the $2,600 level could send Ether towards the $2,660 resistance.
The next major resistance is near USD 2,720. An upside break above the USD 2,720 resistance could send the price higher towards the USD 2,820 resistance zone in the near term.
Another drop in ETH?
If Ethereum fails to clear the USD 2,600 resistance, it could trigger another decline. The initial downside support is near $2,500. The first major support is near the $2,485 zone.
A clear move below the USD 2,485 support could push the price towards USD 2,420 where the bulls could emerge. Any further losses could send the price towards the USD 2,320 support level in the near term. The next major support is at USD 2,250.
Technical indicators
hourly MACD – The MACD for ETH/USD is losing momentum in the bullish zone.
RSI per hour – The RSI for ETH/USD is now below the 50 zone.
Major support level – $2,485
Major resistance level – $2,600