This article is available in Spanish.
Ethereum price started a recovery wave above the USD 2,320 resistance. ETH is now struggling to pace a move above the $2,385 resistance.
- Ethereum started declining again from the resistance at $2,385.
- The price is trading below $2,350 and the 100-hourly Simple Moving Average.
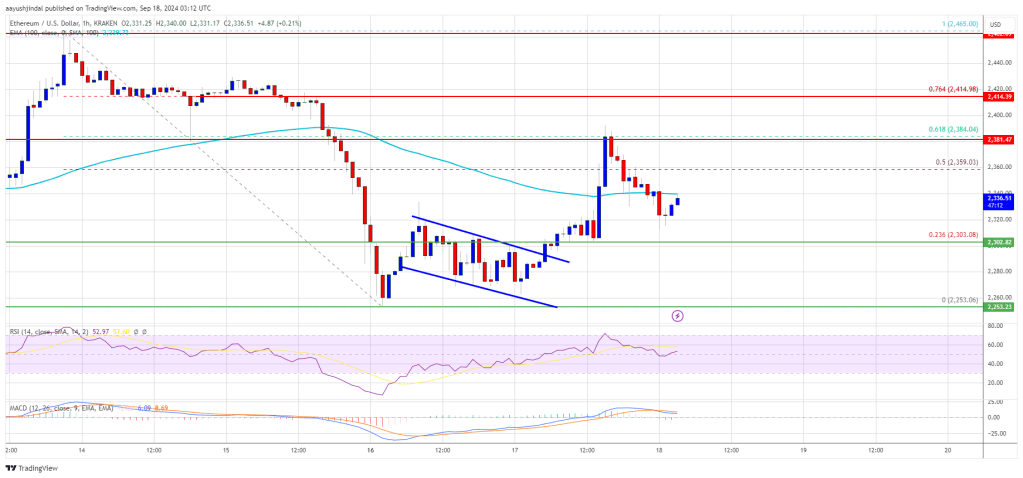
- There was a break above a short-term descending channel with resistance at $2,290 on the hourly chart of ETH/USD (data feed via Kraken).
- The pair needs to overcome the USD 2,350 resistance to continue higher in the near term.
Ethereum price attempts recovery
The price of Ethereum formed a base of almost $2,250 and, like Bitcoin, started a new increase. ETH was able to break the USD 2,300 and USD 2,320 resistance levels.
There was a break above a short-term descending channel with resistance at $2,290 on the hourly chart of ETH/USD. The pair was able to climb above the 50% Fib retracement level of the downwave, from the $2,465 swing high to the $2,252 low.
The price even spiked above $2,260 before the bears appeared. There was a rejection near the 61.8% Fib retracement level of the downward wave from the $2,465 swing high to the $2,252 low.
Ethereum price is now trading below $2,350 and the 100-hourly Simple Moving Average. On the upside, the price seems to be facing hurdles around the USD 2,340 level. The first major resistance is around the $2,385 level. The next major resistance is near USD 2,420.

An upside break above the USD 2,420 resistance could call for more gains. In the mentioned case, Ether could rise towards the USD 2,450 resistance zone in the short term. The next hurdle is near the USD 2,550 level.
Another drop in ETH?
If Ethereum fails to clear the USD 2,340 resistance, it could trigger another decline in the near term. The initial downside support is near $2,300. The first major support is near the $2,250 zone.
A clear move below the USD 2,250 support could push the price towards USD 2,180. Any further losses could send the price towards the USD 2,120 support level in the near term. The next major support is at USD 2,050.
Technical indicators
hourly MACD – The MACD for ETH/USD is losing momentum in the bullish zone.
RSI per hour – The RSI for ETH/USD is now above the 50 zone.
Major support level – $2,300
Major resistance level – $2,385

