

In the ongoing conflict between Iran and Israel, Ethereum (ETH) appears bearish and poised for a significant price drop as it fails to hold a key support level. Furthermore, ETH’s on-chain metrics such as Long/Short ratio and future open interest further support this bearish outlook.
Current price momentum
At the time of writing, ETH is trading around $2,365 and has experienced a price drop of over 4.25% in the last 24 hours. During the same period, trading volume fell by 11%, indicating lower participation from traders and investors, possibly due to fears of further price declines.
Ethereum technical analysis and upcoming level
According to the expert technical analysis, ETH recently broke the crucial support level at $2,400 and turned itself bearish. With the current market sentiment and this collapse, there is a good chance that the price could fall by 7% in the coming days to reach the $2,200 level.
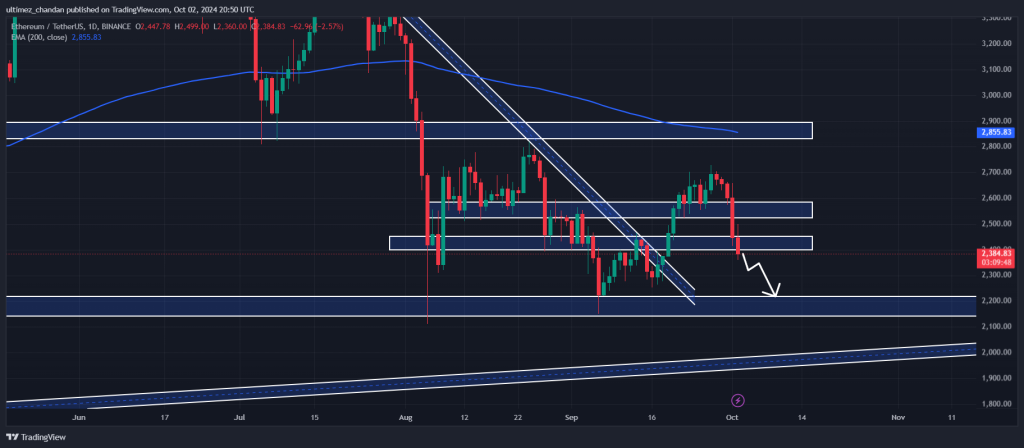
However, ETH is currently trading below the 200 Exponential Moving Average (EMA) on a daily time frame, indicating a downtrend. The 200 EMA is a crucial technical indicator that determines whether an asset is in an uptrend or downtrend.
Bearish on-chain metrics
This bearish thesis receives further support from on-chain metrics. According to the on-chain analytics company Mint glassETH’s Long/Short ratio currently stands at 0.96, indicating bearish market sentiment among traders.
The long/short ratio is an on-chain metric that shows how traders position themselves in long or short bets. If long positions significantly exceed short positions, the ratio will be above 1, and vice versa.
Furthermore, ETH’s future open interest has fallen 4.6% over the past 24 hours and has been steadily declining, indicating growing fear among traders following the recent collapse of crucial support levels.