

- Spot Ethereum ETFs turned positive on August 28 after two weeks of consecutive outflows.
- The ETH price has also seen a strong rebound, with the RSI bouncing from oversold levels.
American spotEthereum [ETH] Exchange Traded Funds (ETFs) posted inflows on Wednesday, August 28, after two weeks of consecutive outflows. The ETFs have seen only nine days of positive flows since they began trading on July 23.
According to data from SoSoValue, inflows into these products reached $5.84 million on Wednesday, coinciding with a strong recovery in Ethereum prices. They currently own $6.9 million in net assets.
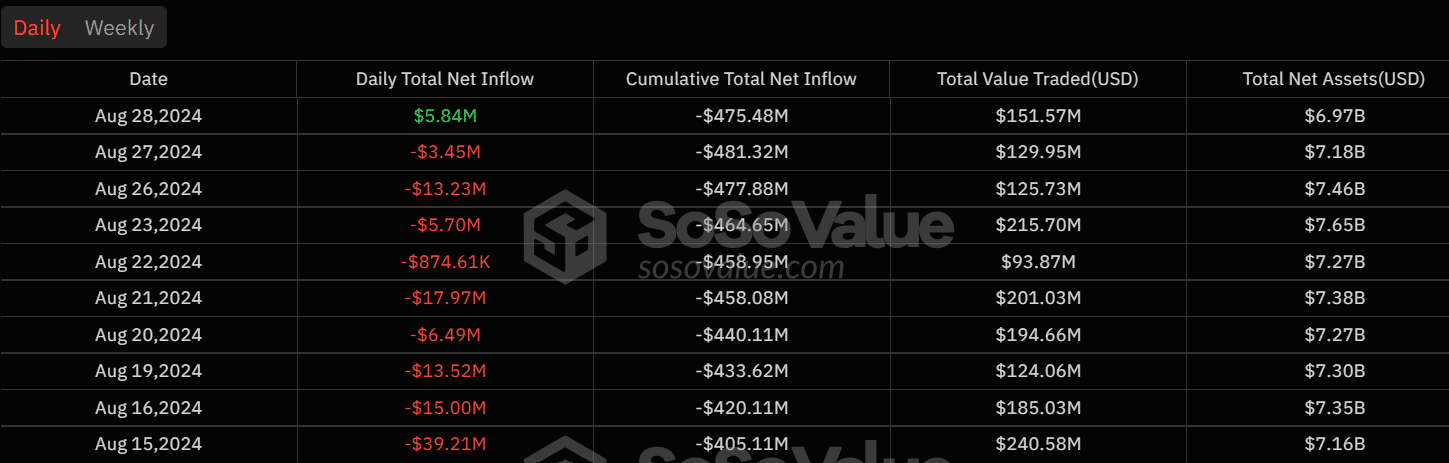
Source: SoSoValue
The BlackRock iShares Ethereum Trust (ETHA) was largely responsible for the recent positive inflows. The ETF has had five consecutive days of zero flows since August 21. The streak was broken on Wednesday with an inflow of $8.4 million.
Fidelity also had inflows of $1.26 million, while the Grayscale ETF had outflows of $3.81 million.
The positive flows fueled gains for ETH, which is up nearly 3% over the past 24 hours and is trading at $2,541 at the time of writing.
RSI shows a strong rebound
ETH’s recent recovery appears to be coming from buyers. The Relative Strength Index (RSI) has recovered from the oversold region below 30.
The RSI line has also made a strong upward move with higher lows and has moved above the signal line, indicating bullish momentum. The crossover also suggests a buy signal and a continuation of the uptrend.
However, despite this recovery, the RSI remains at 41. Buyers should therefore wait until it reaches the neutral level at 50.
The Chaikin money flow also shows an increase in purchasing pressure. However, as this metric remains in the negative territory, a swing to the positive is needed to confirm the upward trend.
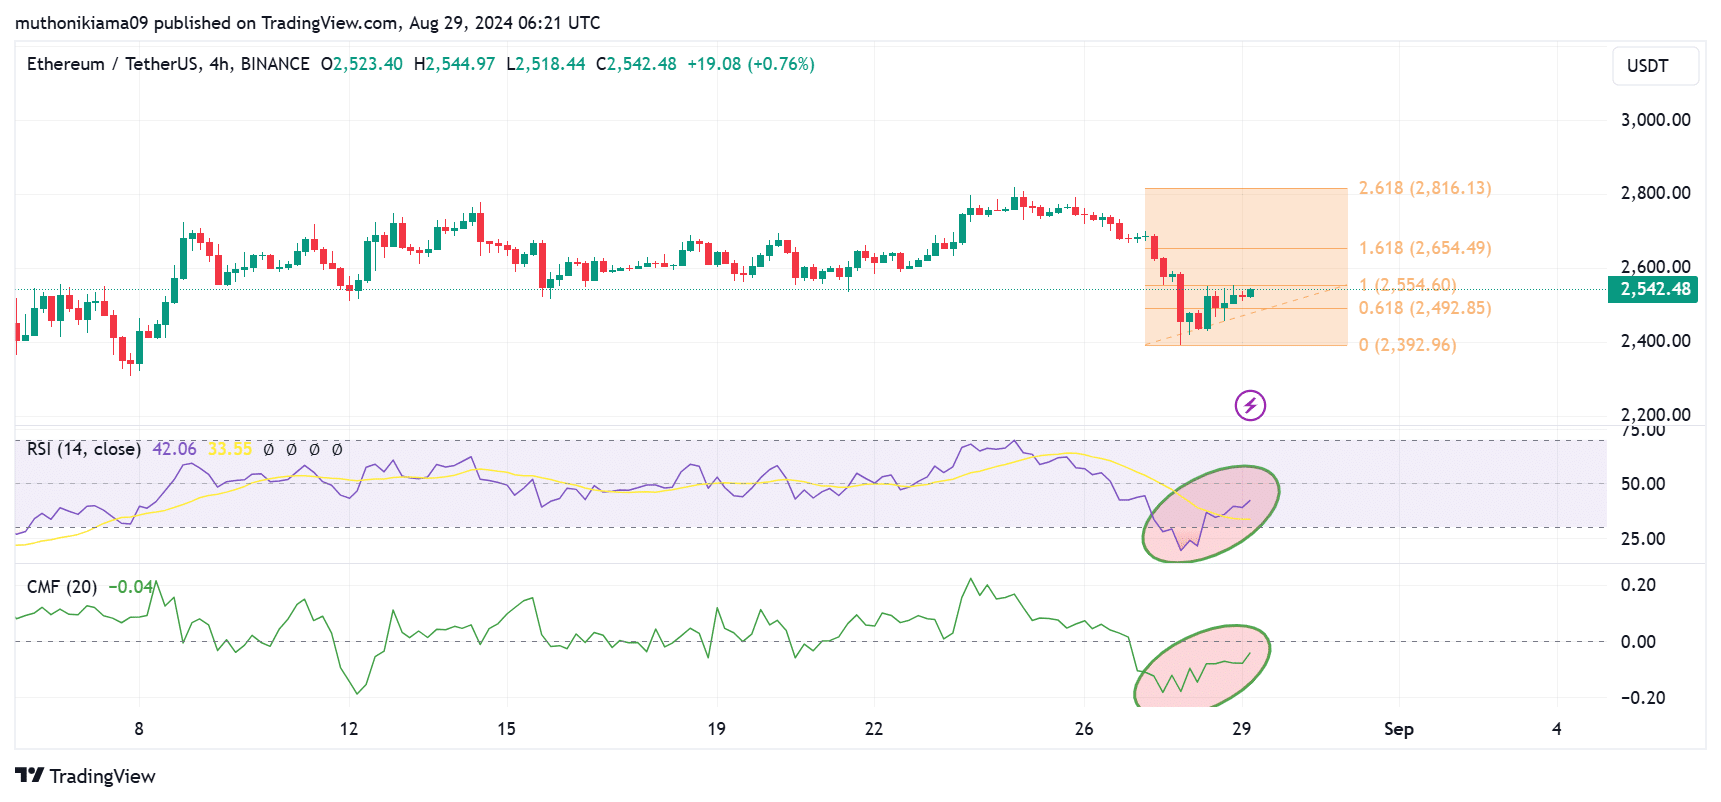
Source: Tradingview
The recent gains saw ETH bounce off the support level at $2,492 and test the resistance at $2,554. If the uptrend continues and ETH breaks above $2,600, the next target will be $2,800.
ETH’s recent gains also see the altcoin outperforming Bitcoin (BTC). However, according to the trader DaanCrypto on X this could cause a correction.
“ETH does that thing again where it is a bit “stronger” than BTC for a few hours. I’m a little scared because that has usually led to more pain this year,” the trader said.
The ratio of Ethereum market value to realized value (MVRV) has fallen to a remarkably low level. This could indicate that ETH is undervalued, making it an opportune time for long-term investors to buy the asset.
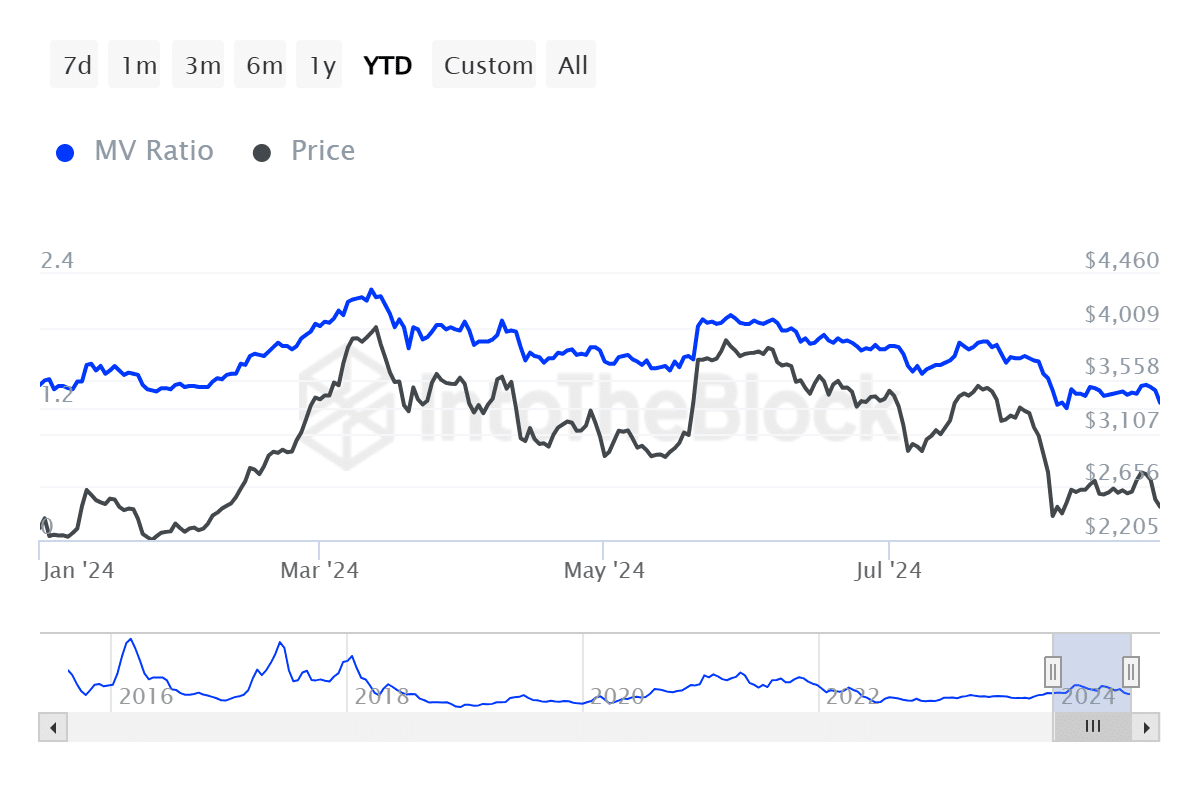
Source: IntoTheBlock
Read Ethereum’s [ETH] Price forecast 2024 – 2025
The falling MVRV ratio could also indicate market capitulation after prolonged bearish sentiment around ETH.
Data from Mint glass shows that Ethereum funding rates have turned positive. This indicates an increase in the number of long positions and a nascent bullish sentiment.