- ETH appeared to form an inverse head-and-shoulders pattern, which often precedes significant upward movement.
- Selling pressure increased steadily, possibly delaying any price recovery.
The past month has Ethereum [ETH] has struggled and lost 12.08% of its value. Although the stock briefly rebounded last week with a 2.69% gain, this momentum appears to be fading.
The combination of chart patterns and current market sentiment – highlighted by a spike in ETH inflows on exchanges – suggests that the recent 0.35% decline over the past 24 hours could extend further.
A bullish pattern emerges, but…
According to analyst Ali Charts, Ethereum is forming an inverse head-and-shoulders pattern on the daily chart. This pattern consists of a left shoulder, a head and a right shoulder.
The inverted heads and shoulders are a classic bullish pattern. It typically indicates a prolonged period of price consolidation before significant upward movement occurs.
ETH is currently developing the right shoulder of the pattern. This reflects the left shoulder, with the price trending downward along a downward trend. If this trajectory continues, ETH could fall further towards the $2,800 region.
At this level, it can consolidate for up to 37 days, just like the left shoulder, before breaking the descending resistance line.


Source: TradingView
A successful completion of this pattern could lead ETH to its first major resistance zone between $3,850 and $4,100. Additionally, ETH could aim for a new all-time high, possibly above the $6,750 mark, as indicated on the chart.
AMBCrypto also noted that current market sentiment indicates that ETH’s near-term downside risk remains high.
The rising currency supply could cause ETH’s decline
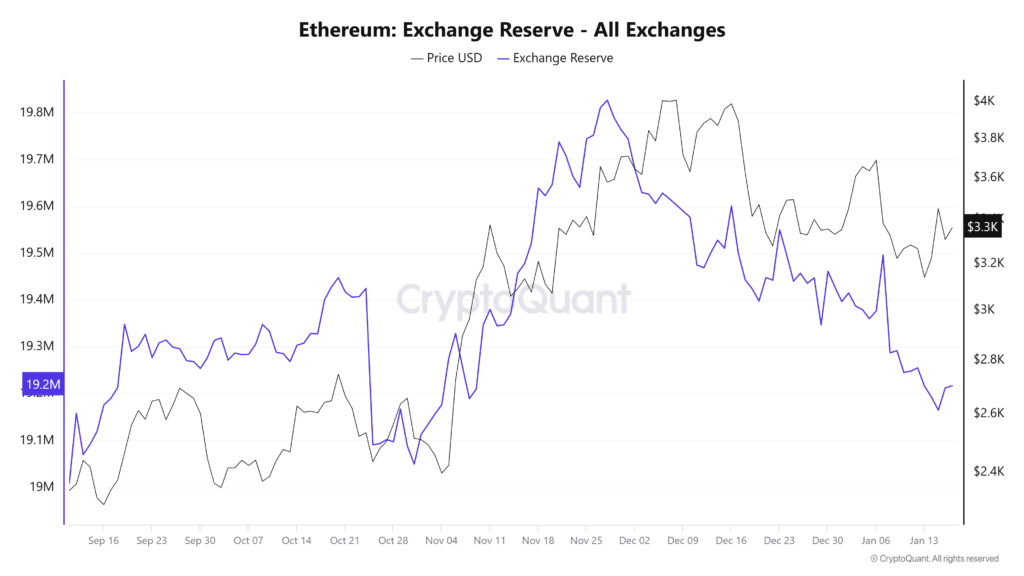
The supply of ETH on cryptocurrency exchanges has steadily increased, raising concerns about potential price pressure.
On January 15, the amount of ETH held on exchanges grew significantly, from approximately 19,164,848 to 19,214,253 ETH at the time of writing – an increase of 49,405 ETH.


Source: CryptoQuant
Such an increase in assets held on the stock exchange usually implies growing selling pressure. Traders may be preparing to sell their assets.
Exchange net flow data, which track the balance of inflows and outflows on the exchanges, support this outlook.
Over the past 24 hours, ETH recorded a positive net flow of approximately 47,761 ETH. This trend indicates a likely increase in the market sell-off, potentially driving the price of ETH lower.
If selling pressure continues, ETH could fall towards the $2,800 region, as evidenced by recent chart patterns.
Institutional sales create extra pressure
Institutional investors have contributed to the growing selling pressure on ETH, with World Liberty Finance leading the way by transferring a significant amount of Ethereum to exchanges.
In its latest activity, World Liberty Finance moved 1,038 ETH – worth $3.44 million – to Coinbase, reducing its total ETH holdings to 5,111 ETH, worth approximately $17.21 million.


Source: SpotOnChain
Read Ethereum’s [ETH] Price forecast 2025–2026
This follows a larger transaction over the past two days, where the same institution deposited 18,536 ETH into Coinbase. The cumulative transfers underscored a potential sell-off strategy, which if executed could intensify downward pressure on ETH’s price.
As institutions adjust their positions and market sentiment remains fragile, ETH’s price may see further declines in the near term.

