

- Ethereum Classic will likely be rejected in its former support zone
- OBV and Open Interest showed that buyer enthusiasm was low
Ethereum classic [ETC] has charted all the gains it made during the January to March rally. At the time, the altcoin’s price had risen from $18.33 to $39.67 at its peak. Unfortunately, the market’s buyers have been disappointing since then.
The drop below the $22.9 level meant that another bearish move seemed more likely than a recovery. Here are the levels and scenarios ETC swing traders should watch out for.
The former support level is now the short-term bullish target
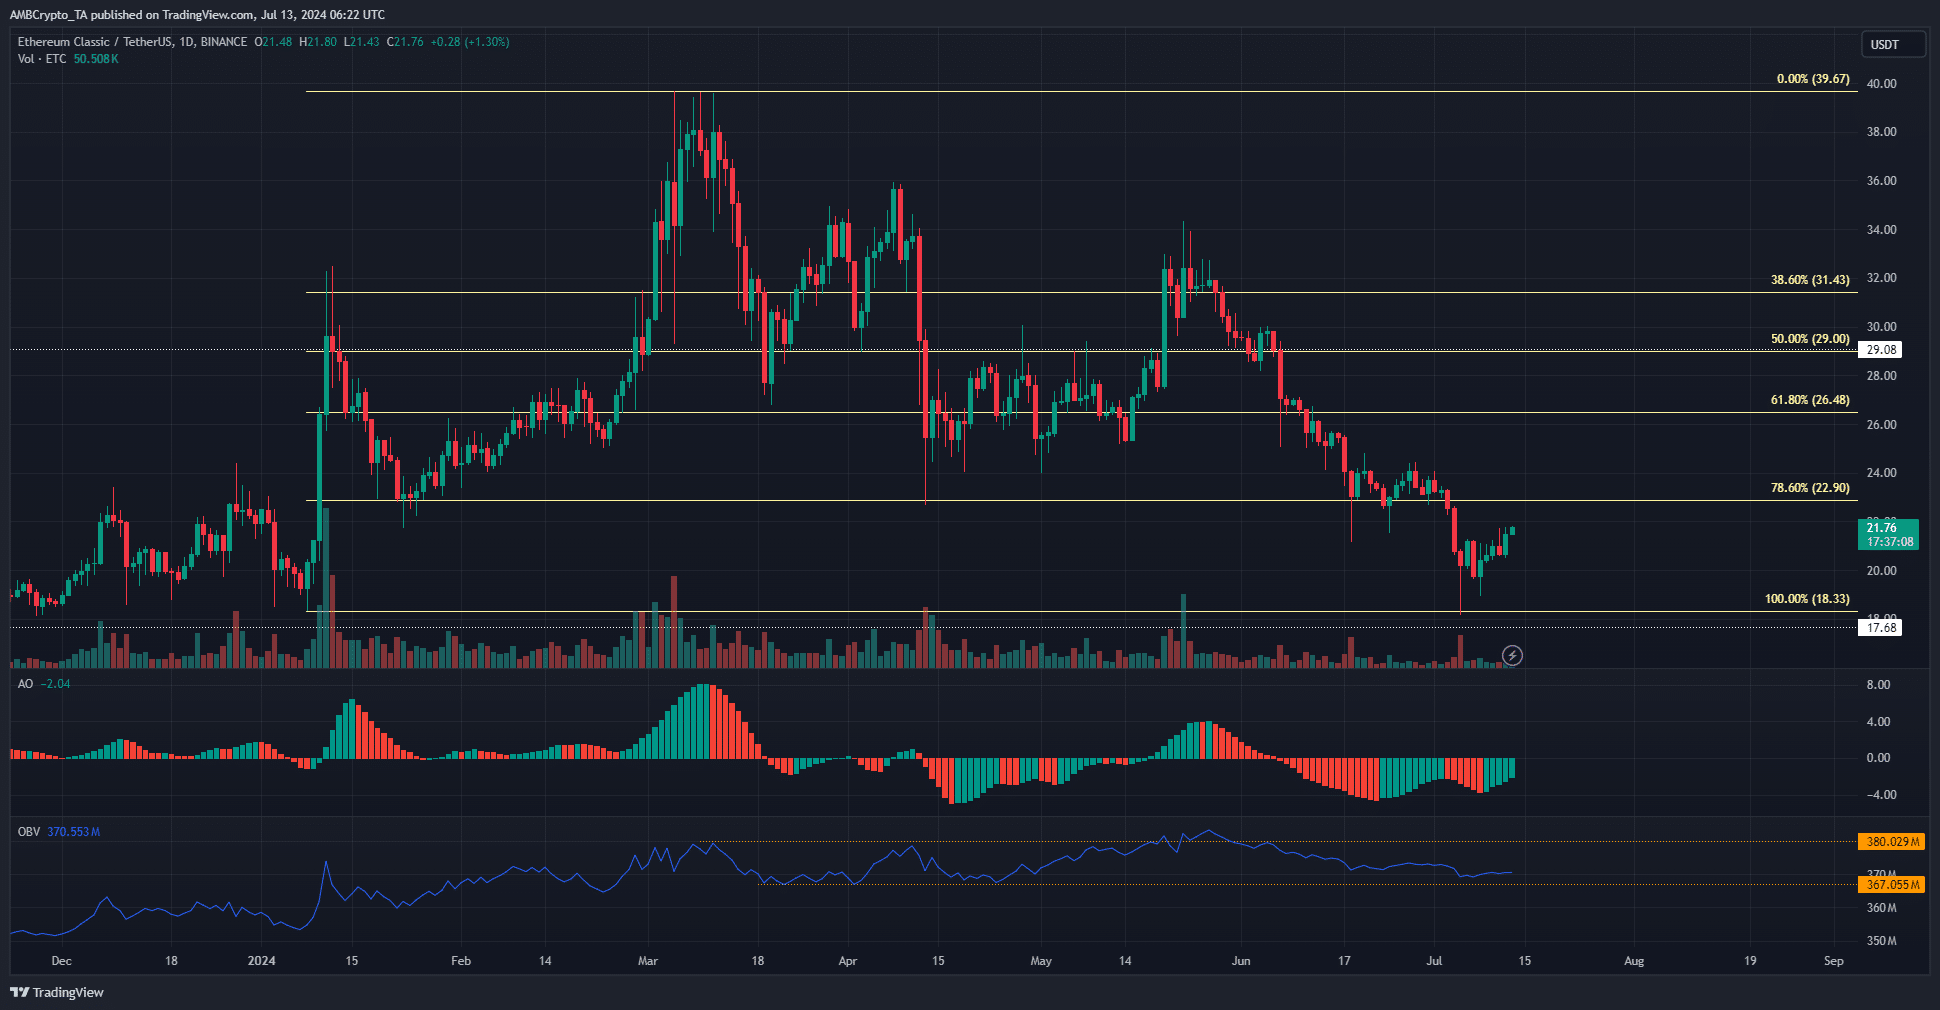
Source: ETC/USDT on TradingView
In April and again in June, the 78.6% retracement level at $22.9 was tested and defended as support. However, the Awesome Oscillator and price action showed that there was a strong downtrend in June.
The support levels in the 50% and 61.8% retracement zones were quickly lost to sellers and in July the bears scored another victory by forcing a decline below $22.9. However, the recent surge to $18.3 does not mean the bulls are winning.
Instead, Ethereum Classic swing traders might want to take short positions around the $23.2-$24.1 zone. More conservative bears can wait for a bearish engulfing candle to go short. With the OBV just above the three-month support level and the AO firmly below neutral zero, the bearish argument is very compelling.
Open Interest at its lowest level since October 2023
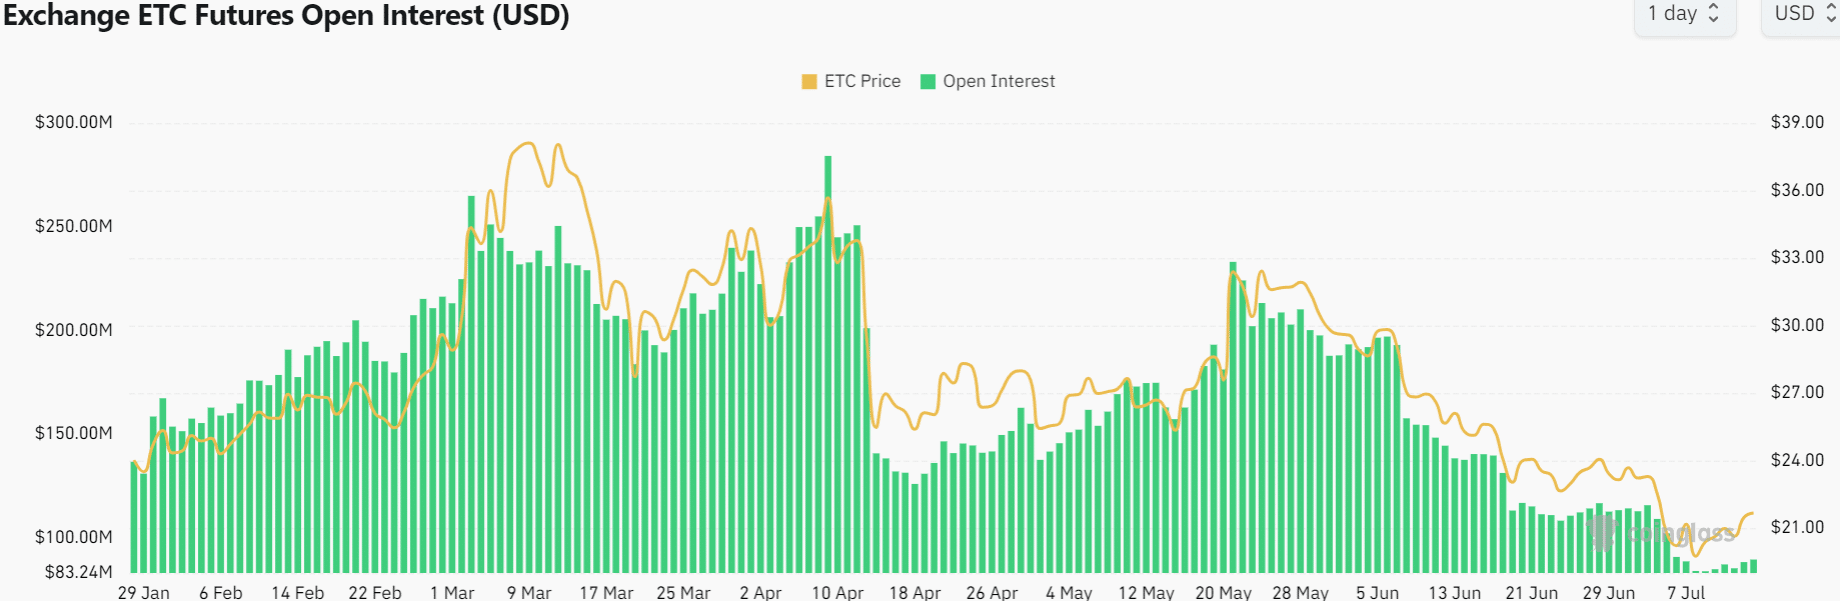
The bulls’ weakness was reflected in the Open Interest chart. In addition to the price, OI has continued to decline and stood at $89.7 million at the time of writing.
Despite the 10.6% price increase last week, speculators did not seem eager to bid.
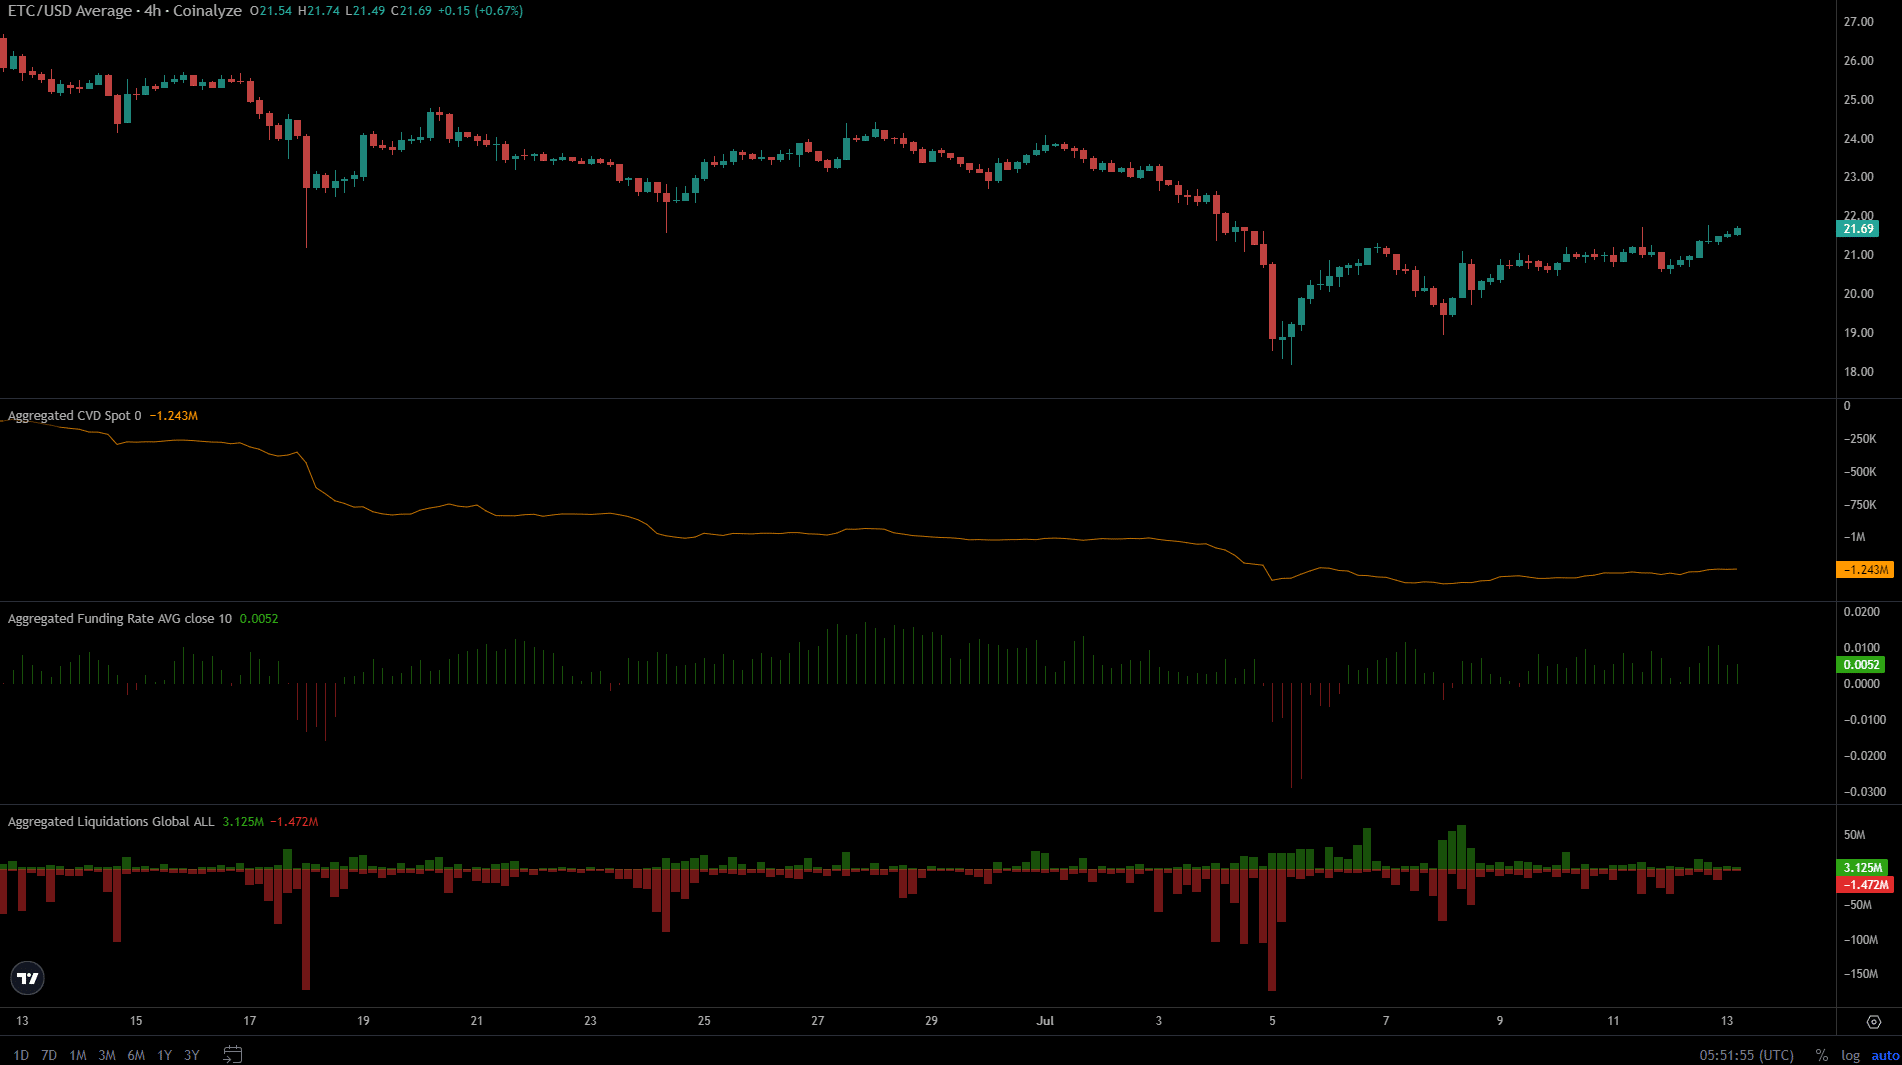
Furthermore, spot CVD halted its downtrend over the past week and was slowly climbing higher at the time of writing. The funding rate was positive, underscoring the presence of bullish sentiment.
Read Ethereum Classic’s [ETC] Price forecast 2024-25
The short liquidations on July 8 after the $21 rejection indicated a liquidity chase. Traders should watch for a price surge that clears short positions, as this could warn of a liquidity chase in the opposite direction during the move towards the $23 resistance zone.
Disclaimer: The information presented does not constitute financial, investment, trading or other advice and is solely the opinion of the author.