

- The ETH price has risen 14.5% over the past week.
- The number of active Ethereum addresses has reached 5 million in the past week, while active buyers have increased.
Since hitting a weekly low of $2,251 on September 16, Ethereum [ETH] has experienced an increasing trend. In fact, at the time of writing, ETH was trading at $2,641. This represented an increase of 14.50% compared to the previous week.
Prior to the upswing, Ethereum was in a downtrend for the past month.
The recent shift in market sentiment has analysts wondering whether this upward trend is part of a sustainable recovery and what is driving this increase. Analysts have suggested that the current upward trend stems from increased active buyers.
What market sentiment says
In their analysis ChainStatsPro mentioned increased active buyers and spot limit bids.
Following this analogy, liquidation hunts have continued in the futures markets for ETH as spot-limit bids have been filled. However, CVD remains stable and the bids and requests are piling up to $2400 and $2790.
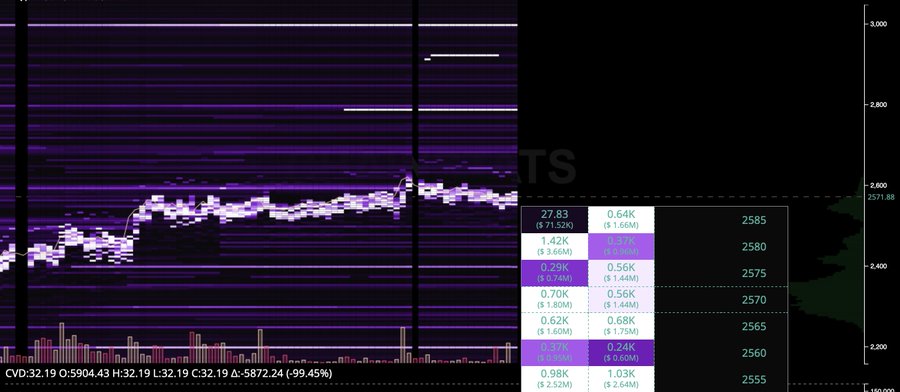
Source: ChainStatsPro
What this means is that active buyers are acquiring ETH at current market rates, indicating increased demand. Thus, traders position themselves to buy when ETH drops to $2400 and sell when ETH reaches $2790. These order bids indicate increased market activity.
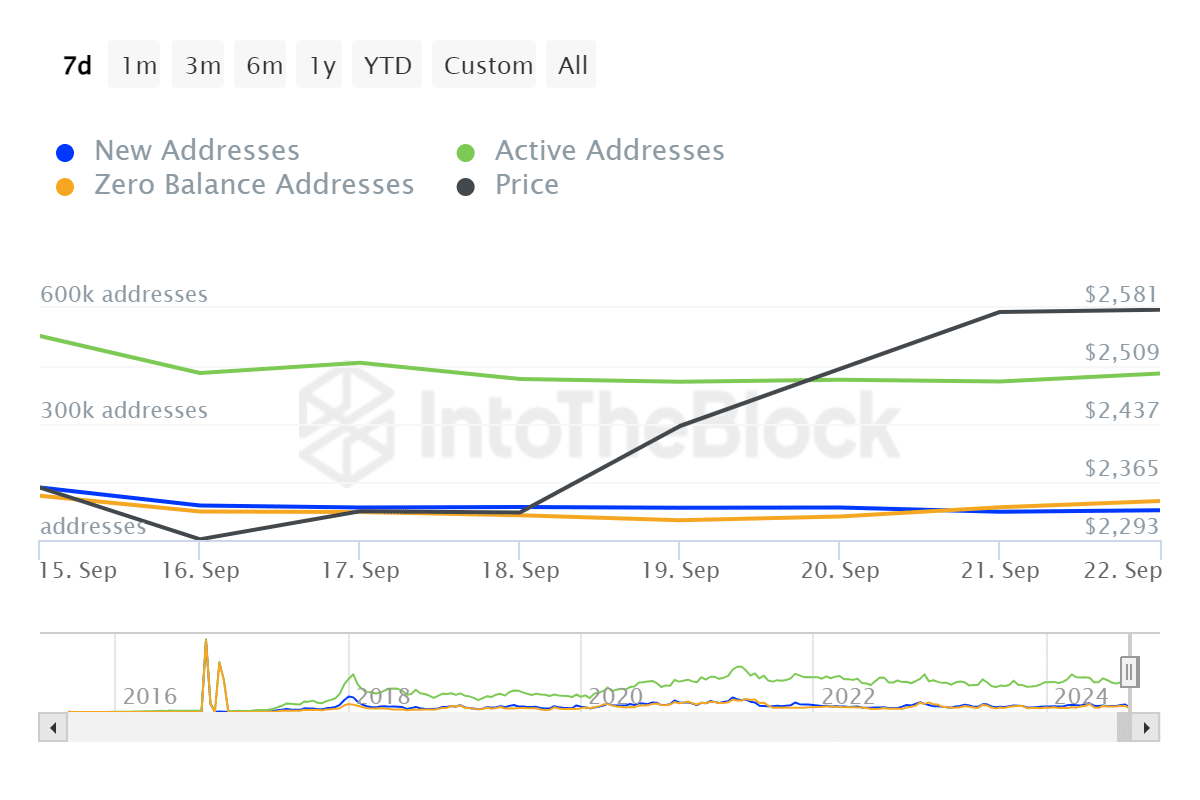
Source: IntoTheBlock
Looking further, the increase in active buyers and investors setting spot limits is illustrated by a higher number of active addresses over the past seven days.
According to IntoTheblock, 5 million active addresses were reached in the past week. This indicates more transactions as more users are actively involved in the network. This is bullish market sentiment as an increase in the number of active addresses leads to higher prices.
What ETH Charts Indicate…
As observed by ChainStatsPro, ETH has experienced a surge in transaction activity over the past week. These market conditions have caused Ethereum to experience continued upward momentum over the past week.
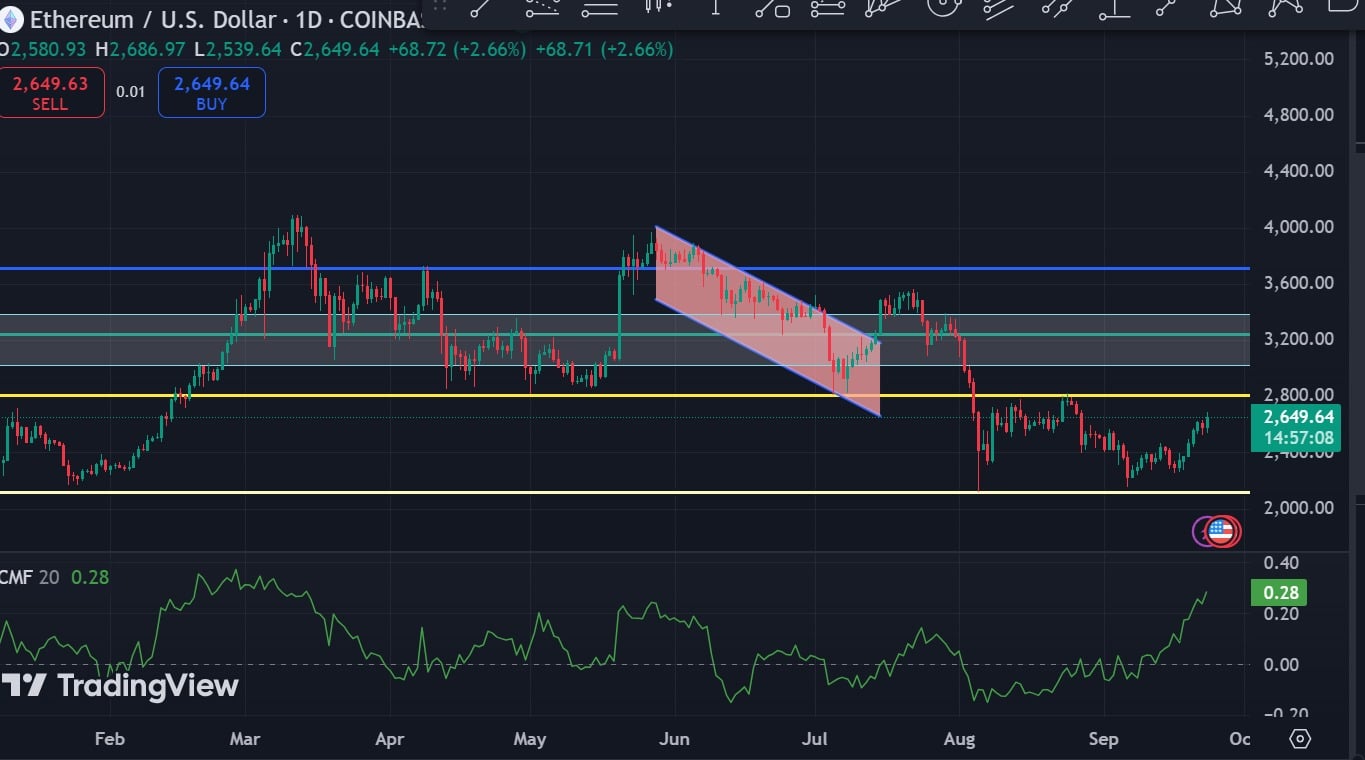
Source: Tradingview
To start with, this increase in buying pressure was further supported by a positive Chaikin Money Flow (CMF). At the time of writing, Ethereum’s CMF stood at 0.28, indicating that buyers are actively accumulating the asset.
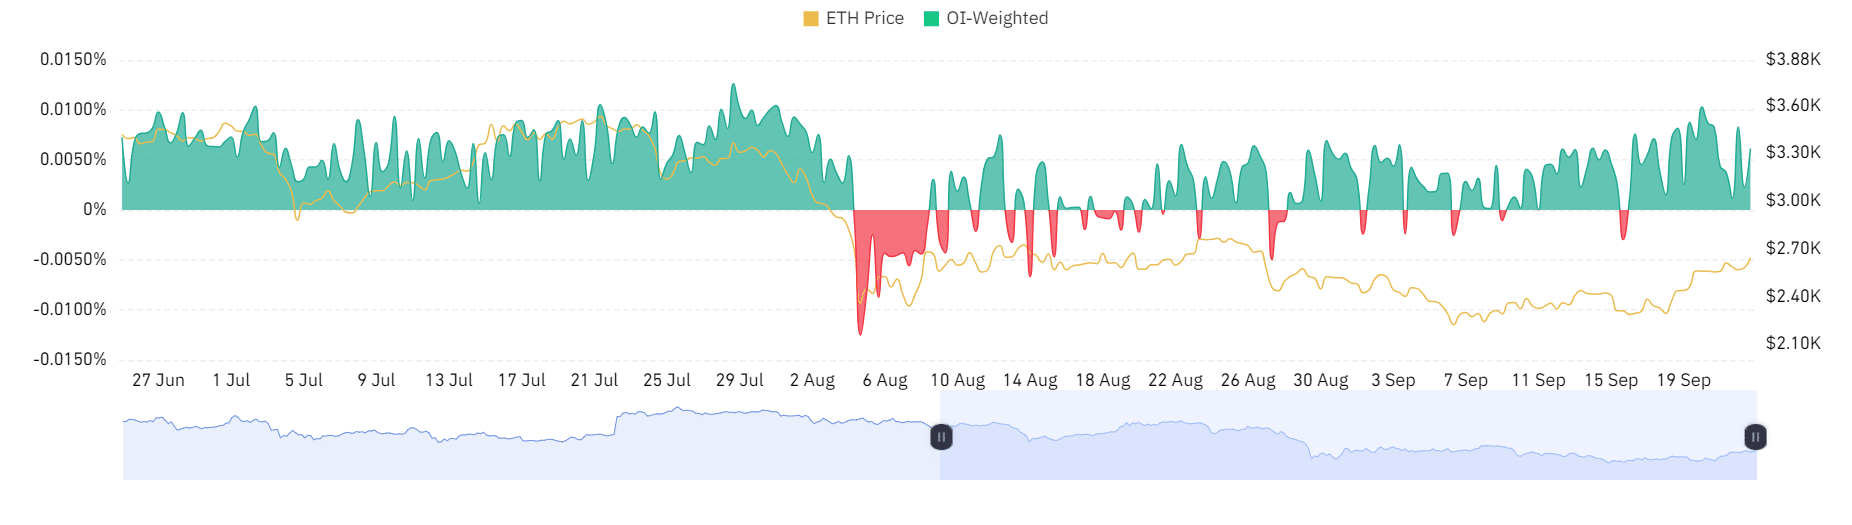
Source: Coinglass
Finally, Ethereum’s OI-weighted funding rate was positive this past week. A positive OI-weighted funding rate indicates increased demand for long positions, with these holders paying short.
Read Ethereum’s [ETH] Price forecast 2024–2025
Therefore, as noted by ChainStatsPro, ETH is experiencing an increase in active buyers. This positive market sentiment positions the altcoin for further gains.
If current conditions persist, ETH will attempt a $2800 resistance level in the near term.