The crypto space is becoming volatile due to the rise in US consumer prices in September. Amid growing volatility, Bitcoin temporarily broke $59,000. However, the top meme coin, DOGE, is showing a bullish reversal opportunity.
Despite yesterday’s 1.82% decline during the broader market correction, the DOGE price trend maintains dominance above $0.10. Since the meme coin is up 2% today, will this bullishness lead to a reversal rally? Read it now in our Dogecoin price analysis.
Dogecoin Price Analysis
With an increase of 1.62% in the last 24 hours, Dogecoin has a market capitalization of $15.80 billion. The meme coin is currently trading at $0.1080 and is the 8th largest cryptocurrency on the market.

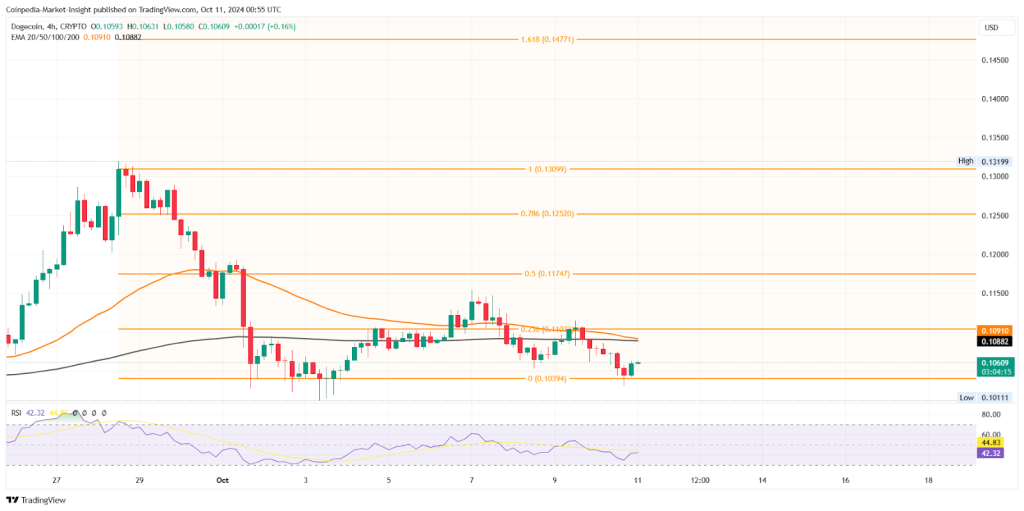
On the 4-hour chart, Dogecoin’s price action reveals a sideways shift in the recent correction phase, with support defined at a base level of 0.10394. The meme coin shows a V-shaped inversion.
Additionally, the reversal rally teases a double bottom formation with a neckline near 0.1140. Currently, the meme coin has formed four consecutive bullish candles, gaining 3.60% in the past 12 hours.
Technical indicators:
EMA: The crucial 50 EMA warns of a bearish crossover with the 200 EMA, resulting in a deathcross event.
RSI: The 4-hour RSI line reveals a bullish divergence in the potential double bottom pattern, increasing the likelihood of a bullish comeback.
Dogecoin Breakout Targets
With the V-shaped recovery, the meme coin is rising towards the 200 EMA on the 4-hour chart. Based on the Fibonacci level, the overhead resistance for the meme coin is at $0.10977, with the breakout target at the 50% level at $0.1168.
On the other hand, in case of a bearish reversal from the 200 EMA, the crucial support points are at $0.10394 and $0.1011.
Wondering if Dogecoin will hit $1 in the next bull run? Read Coinpedia’s insightful DOGE price forecast for 2024 to 2030 to find the price targets of the next rally.

