

- Polkadot has experienced a strong revival in recent weeks. Can the bulls continue to apply pressure?
- The altcoin’s derivatives data showed a slight bullish edge.
Dot [DOT] The recent recovery has placed the altcoin at an important juncture, at the confluence of the 20-day and 50-day EMAs and at the crucial resistance level of $6.5.
For almost three weeks, DOT saw higher lows on the daily chart, recovering from short-term trendline support. A potential close above or below this support level will likely lead to a volatile move in the coming weeks.
DOT was trading around $6.2 at the time of writing, up about 0.5% over the past day.
Can DOT bulls spark a rally?
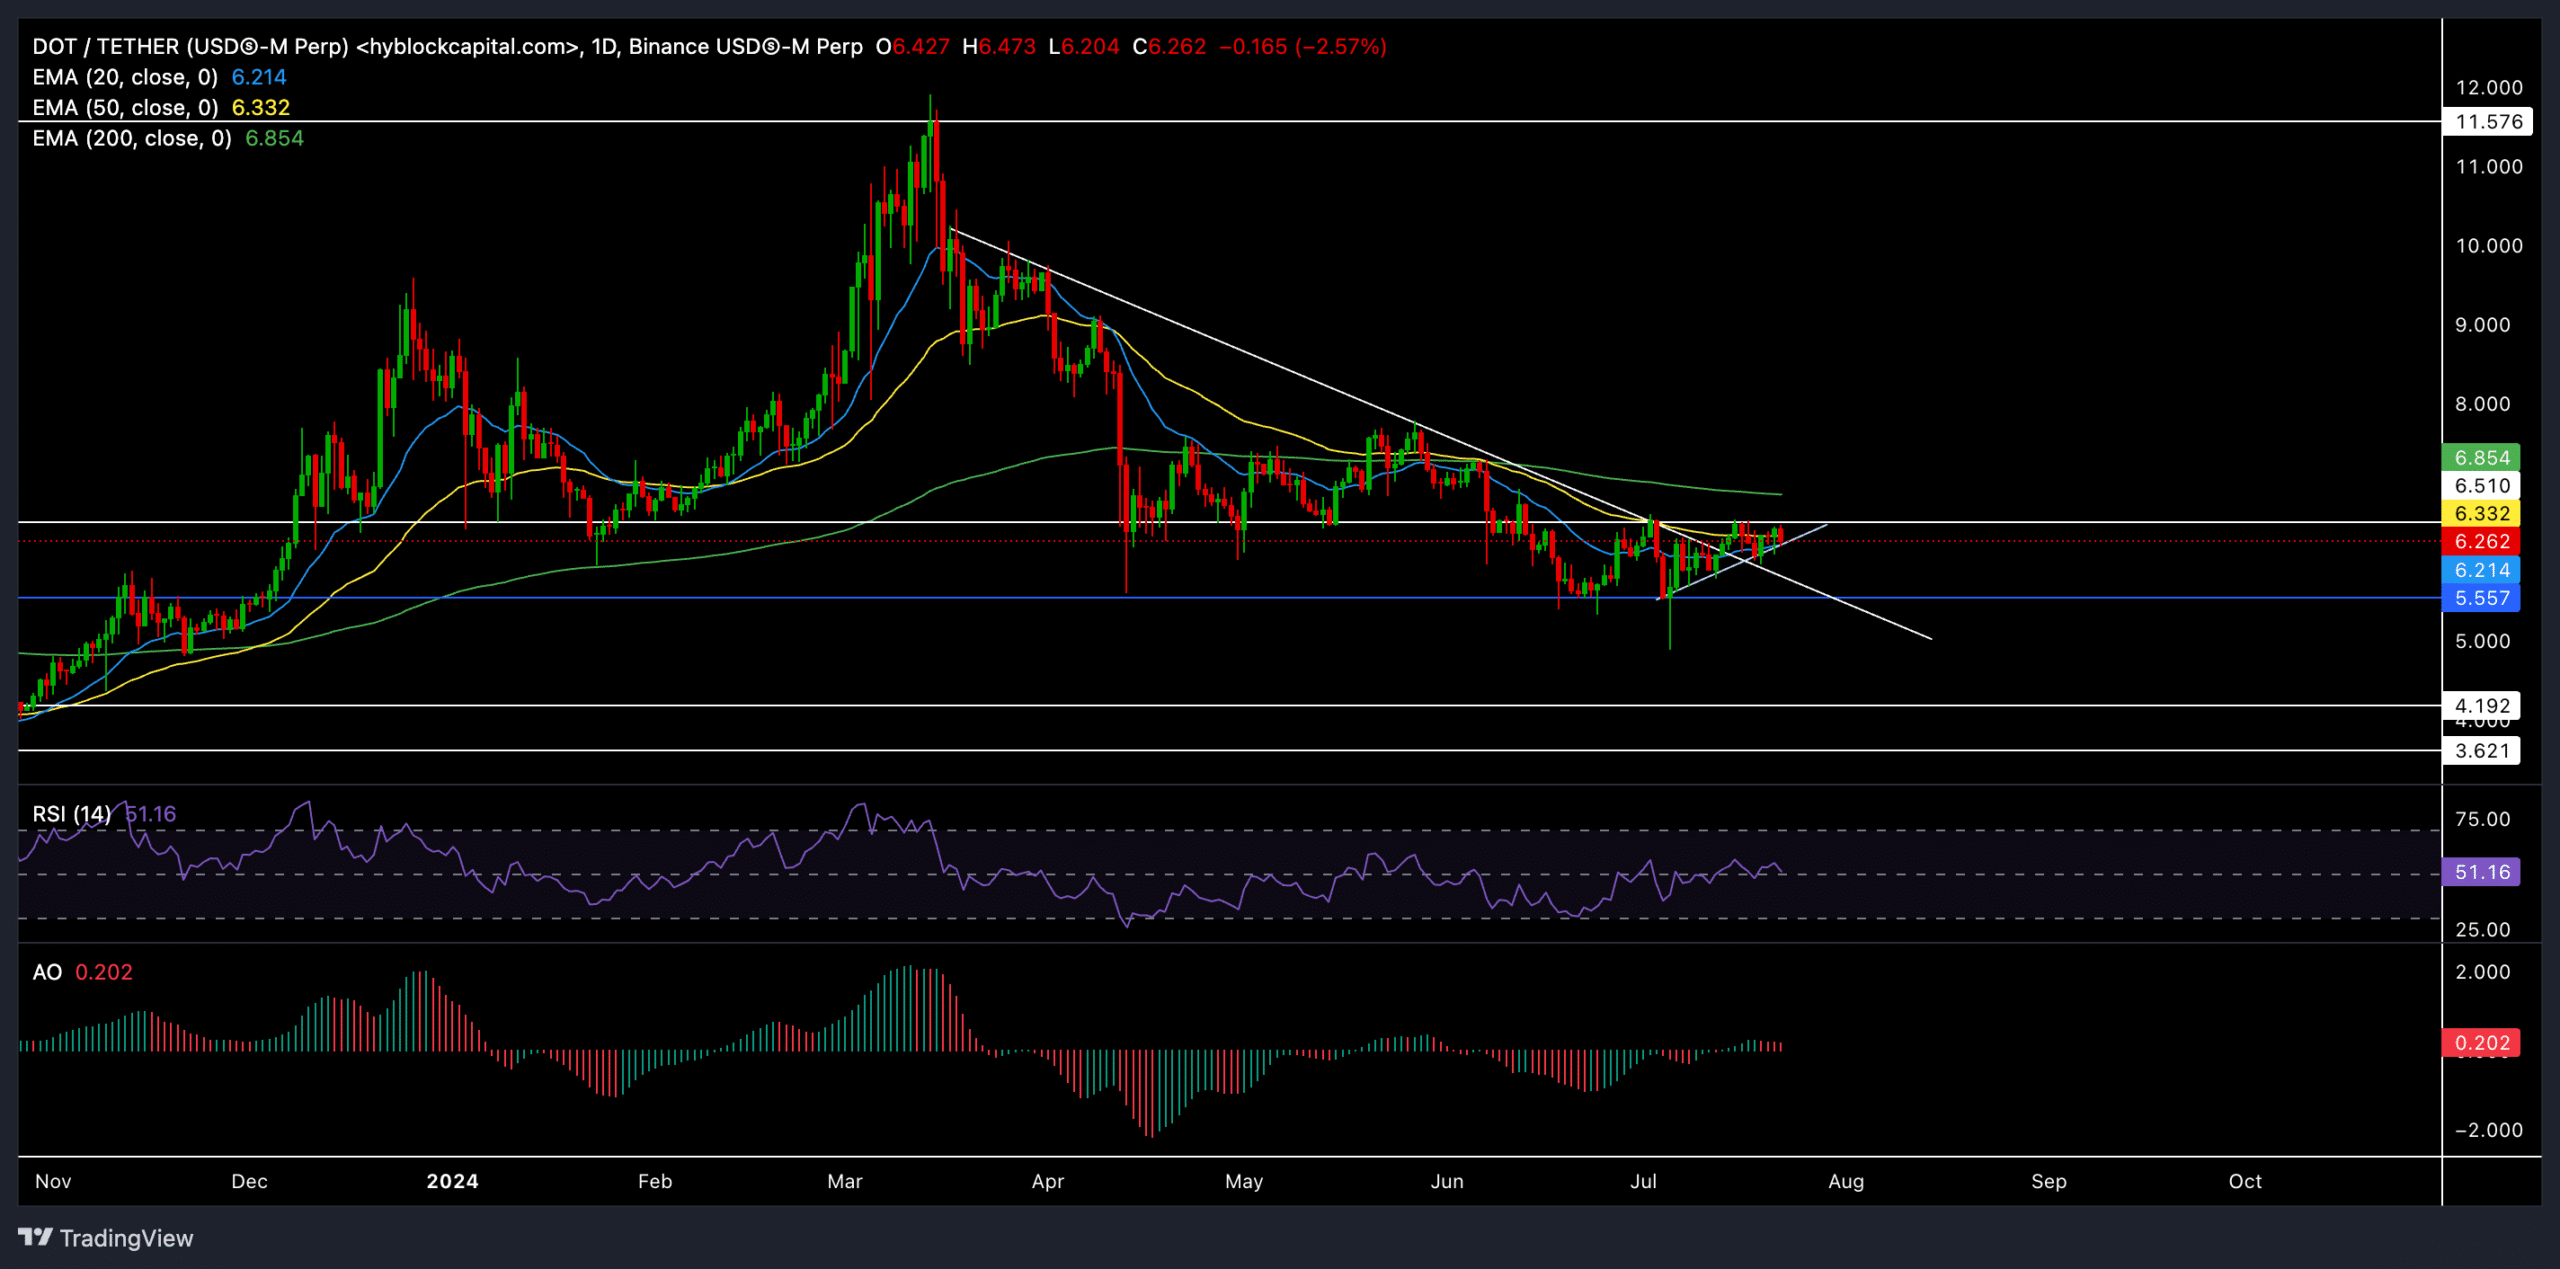
Source: TradingView, DOT/USDT
The reversal of the $11.5 resistance in March set the stage for the bears to trigger a series of red candles. As a result, DOT has lost nearly 45% of its value in the past three months after hitting a two-year high in March.
DOT then found support near the $5.55 level, which the bears tested twice in the past month. It is worth noting that the altcoin fell below the crucial 20, 50, and 200-day EMA levels during this downturn.
However, the recent recovery from the $5.55 baseline has revived some hope for a recovery. DOT is up almost 13% over the past three weeks. In the meantime, it also tested the USD 6.5 resistance several times and formed an ascending triangular structure.
Should the price close above the immediate resistance level at $6.5, it could trigger an immediate uptrend. The 200 EMA at $6.8 would be the first major resistance level in this case.
However, if the price falls below the 20 and 50 day EMA, it could delay the immediate recovery prospects. In this case, DOT would likely recover from the USD 5.55 level to retest the USD 6.5 resistance.
The Relative Strength Index eventually settled above the 50 level, reaffirming a decline in selling pressure. However, buyers should wait for a sustained close above this level to assess the chances of an uptrend in the coming days.
Similarly, the Awesome Oscillator closed above its equilibrium, but has seen a few red lines on its histogram in recent days.
Read Polkadot [DOT] Price forecast 2024-2025
Here’s what the derivatives data revealed
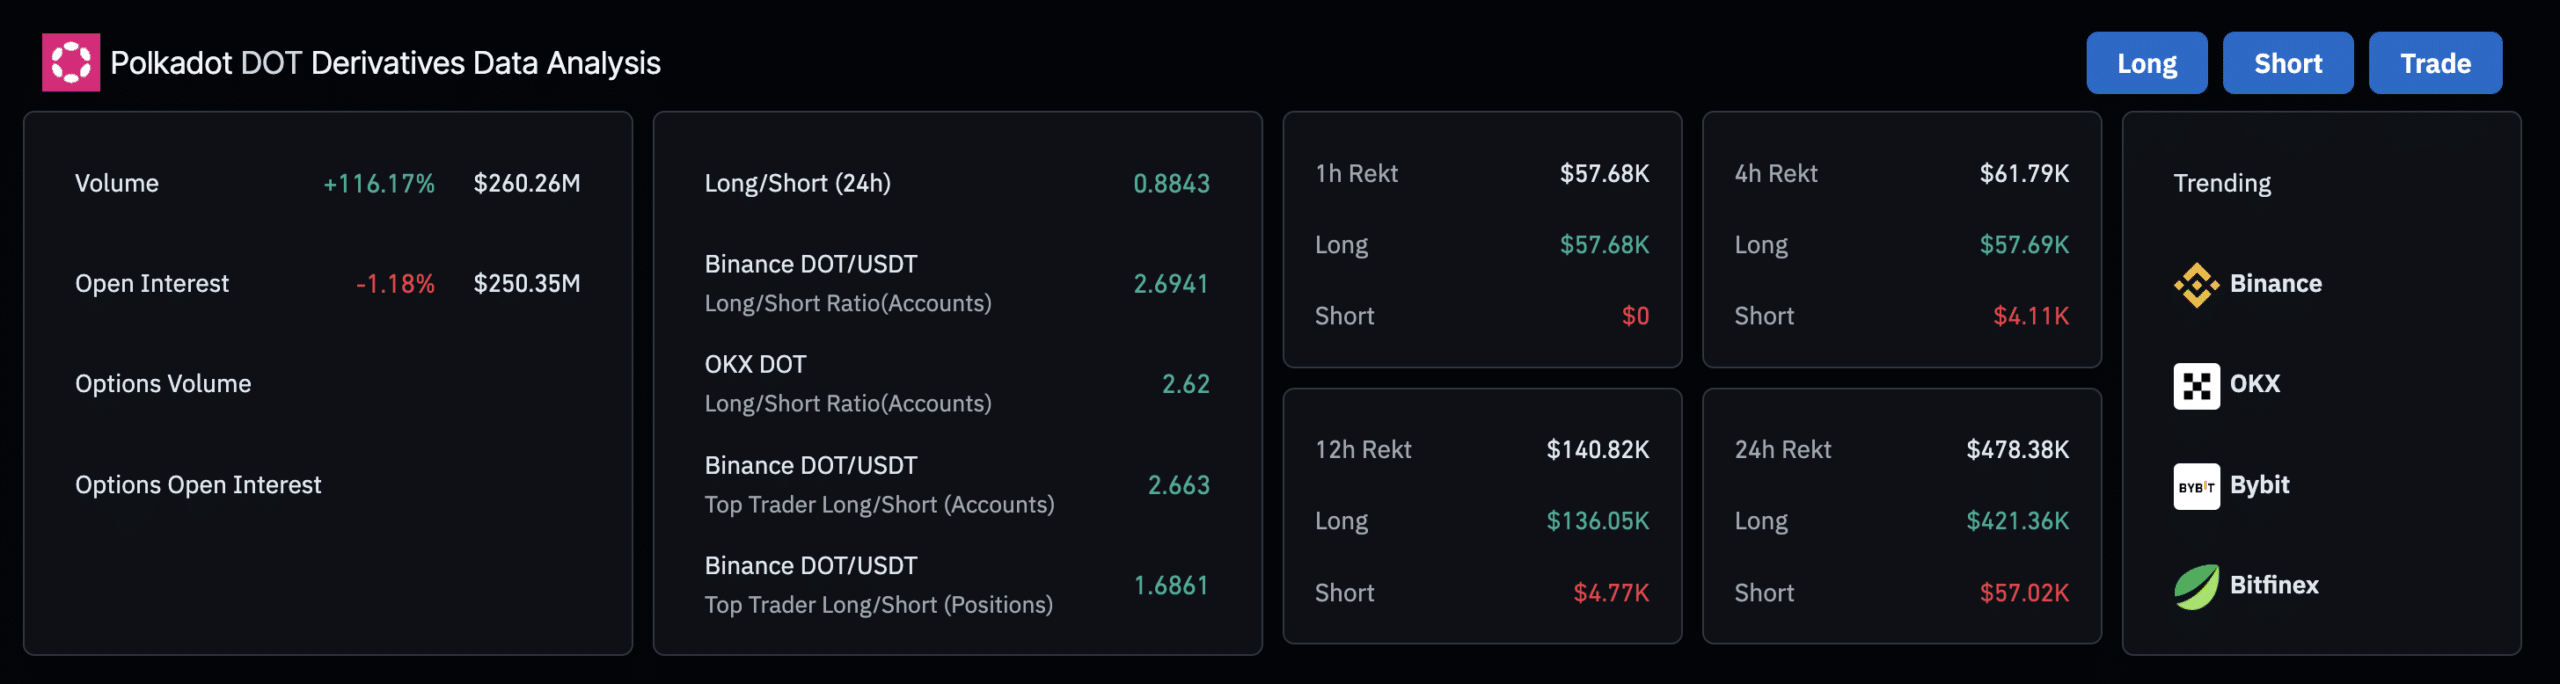
Source: Coinglass
Coinglass data showed bullish sentiment among traders, especially on Binance and OKX. However, the overall market appears to be a little more short-biased over the past 24 hours.
Traders are now positioning themselves for potential bigger moves, with a slight bias toward long positions. However, it is crucial to consider Bitcoin and general market sentiment before making trading decisions.