

Dogecoin’s exchange dynamics have shifted at a key moment, with new data on the chain pointing to a near-term shift in market structure. Crypto analyst Ali Martinez (@ali_charts) highlighted a Glassnode chart showing that Dogecoin’s net supply on centralized exchanges just turned positive, noting on X: “Dogecoin’s supply on exchanges just turned positive! This shift has marked sharp rebounds before.”
Load Dogecoin rebound?
The diagram in his after“DOGE: Exchange Net Position Change – All Exchanges,” tracks monthly currency inflows and outflows as a histogram, alongside DOGE’s rate in US dollars. Green bars represent net inflows (more DOGE moving to exchanges than leaving), while red bars represent net outflows.
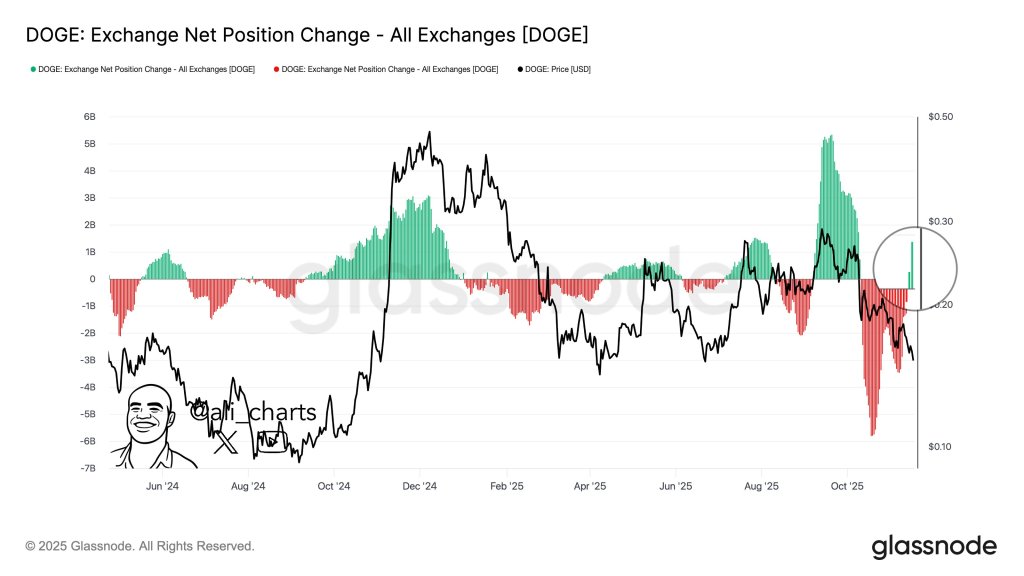
From mid-2024 to late 2024, the series alternates between modest red and green periods before a persistent cluster of strong green bars emerges around the fourth quarter of 2024. During that phase, net inflows increase to several billion DOGE per month. At the same time, the price line accelerated from below $0.10 to a local peak at $0.48, illustrating how heavy activity on the exchange rate side accompanied the rally.
Related reading
After that peak the structure changes. In early and mid-2025, the histogram becomes more mixed, with smaller positive and negative values, as the price roughly fluctuates between about $0.12 and $0.30. Heading into late 2025, however, the chart shows a pronounced series of red bars, with net outflows extending downward toward roughly −5 to −6 billion DOGE, while price trends decline from the mid-$0.20s to the low $0.20s and below.
The final data point, highlighted by a circular marker on the right side of the chart, marks a clear break in that pattern: a high green bar crosses above the zero line again, indicating that net flows have turned positive again. At that point, the price line is slightly above $0.15 on the vertical scale. Martinez interprets this as an “important recovery signal,” pointing to previous cases where a similar transition from sustained outflow to strong inflow coincided with sharp changes in direction.
DOGE on thin ice under $0.16
A second chart he shared, an ATH-partitioned UTXO Realized Price Distribution (URPD), shows where current DOGE supply last moved in the chain. A single, dominant bar appears around $0.07392452 and accounts for 28,260,298,271,803 DOGE, or 18.62% of the measured supply. Martinez summarizes this by saying that 27.4 billion DOGE has been collected for about $0.08, calling this the “key level of support.”
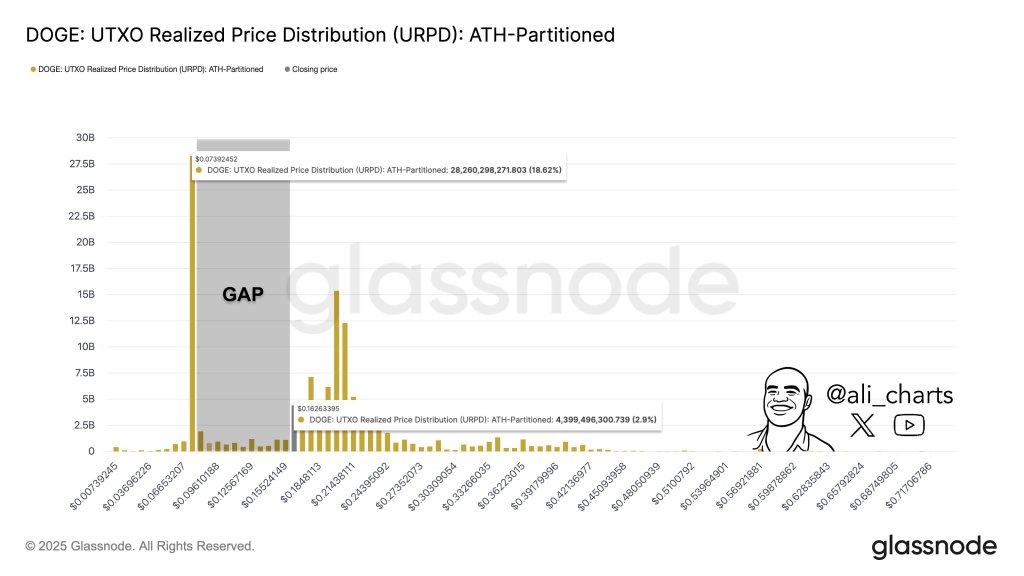
Between that block of $0.07–$0.08 and around $0.16, the URPD shows a shaded “GAP” with only small intermediate bars around levels such as $0.096, $0.125 and $0.155. Above the gap, a smaller but still notable cluster appears at around $0.162633395, containing 4,399,496,300,739 DOGE (2.9% of supply). “Below $0.16, support for Dogecoin $DOGE is disappearing quickly,” Martinez warns, adding that the “next real demand zone is $0.07.”
Related reading
A third graph, a cost distribution heatmap, tracks DOGE’s price against horizontal bands showing where holders’ cost bases are concentrated. It confirms two core cohorts: a lower band between $0.0812497 and $0.08279775 with 27,397,971,652.123432 DOGE, and an upper band from $0.20103297 to $0.20486326 with 12,156,333,652.493444 DOGE.
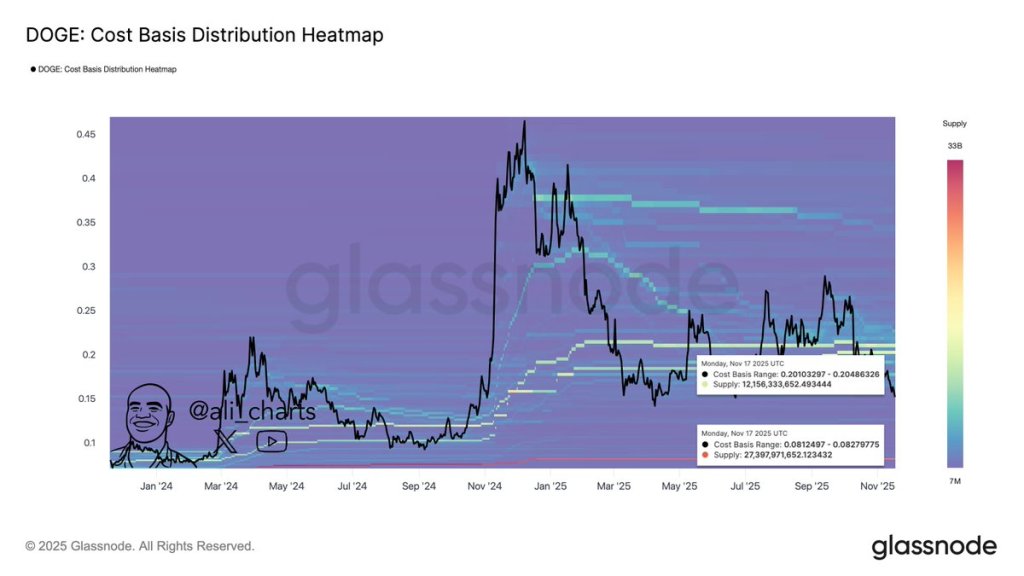
Together with the new positive exchange rate flows, these data points define a market caught between a tight realized bottom around $0.08 and a substantial holding cluster around $0.20, with the latest flow reversal now in view for traders following DOGE’s next move.
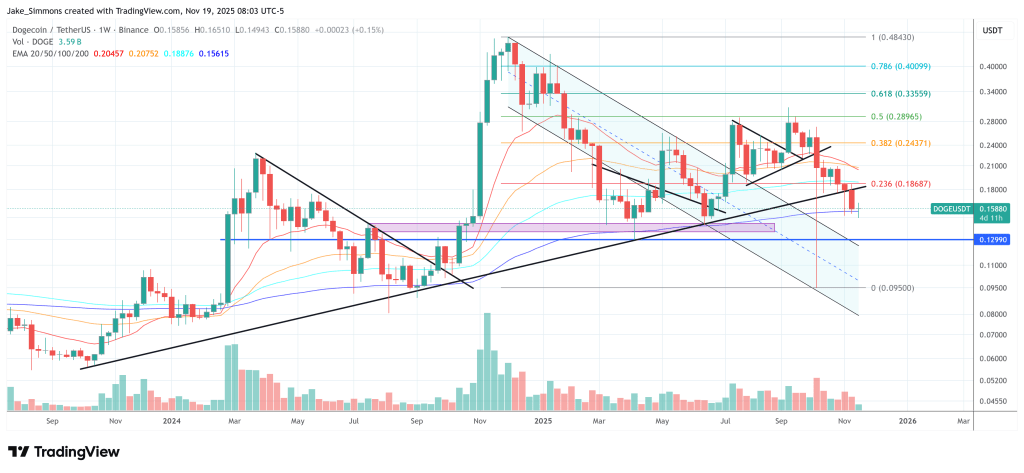
At the time of writing, DOGE was trading at $0.158.
Featured image created with DALL.E, chart from TradingView.com