
 sinks further into the red as momentum turns sharply bearish")
Dogecoin started a new decline below the $0.1250 zone against the US dollar. DOGE is now consolidating losses and could face hurdles near USD 0.1235.
- DOGE price started a new decline below the USD 0.1250 level.
- The price is trading below the USD 0.1220 level and the 100-hour simple moving average.
- A major bearish trendline is forming with resistance at $0.1300 on the hourly chart of the DOGE/USD pair (Kraken data source).
- The price could extend losses if it remains below USD 0.1280 and USD 0.1300.
Dogecoin price continues to fall
The Dogecoin price started to fall again after closing below $0.1300, just like Bitcoin and Ethereum. DOGE fell below the USD 0.1280 and USD 0.1250 support levels.
The price even traded below $0.1220. A low was formed near $0.1198, and the price is now showing bearish signs. It is consolidating below the 23.6% Fib retracement level of the downward move from the $0.1305 swing high to the $0.1198 low.
The Dogecoin price is now trading below the $0.1280 level and the 100-hourly moving average. If there is a recovery wave, immediate upside resistance will be around the $0.1235 level. The first major resistance for the bulls could be near the $0.1280 level or the 76.4% Fib retracement level of the downward move from the $0.1305 swing high to the $0.1198 low.
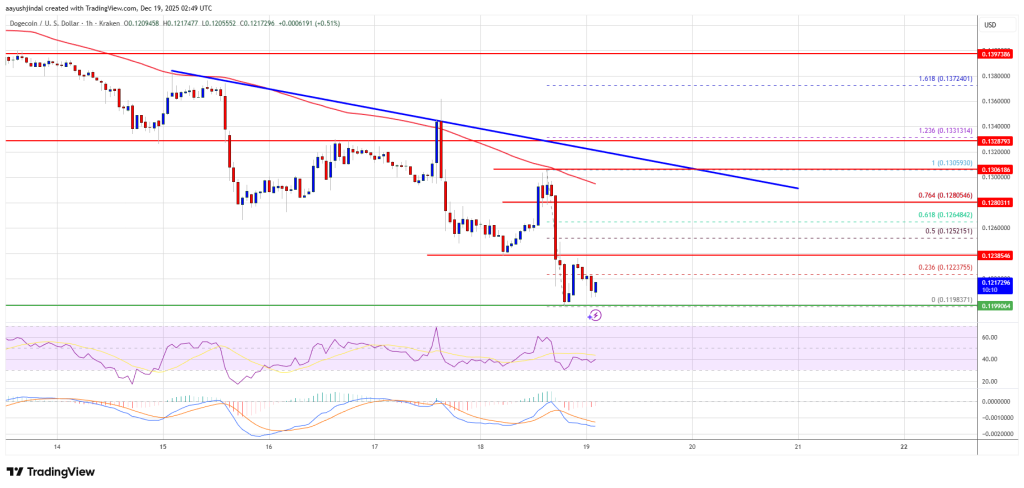
The next major resistance is near the $0.1300 level. There is also a major bearish trendline forming with resistance at $0.1300 on the hourly chart of the DOGE/USD pair. A close above the USD 0.1300 resistance could send the price towards the USD 0.1350 resistance. Any further gains could send the price towards the USD 0.1372 level. The next big stop for the bulls could be $0.1400.
Lose more at DOGE?
If DOGE price fails to rise above the USD 0.1300 level, it could continue to decline. The initial downside support is near the $0.1200 level. The next major support is near the $0.1195 level.
The main support is at $0.1150. If there is a downside break below the USD 0.1150 support, the price could fall further. In the mentioned case, the price could slide towards the $0.1050 level or even $0.10 in the short term.
Technical indicators
Hourly MACD – The MACD for DOGE/USD is now gaining momentum in the bearish zone.
Hourly RSI (Relative Strength Index) – The RSI for DOGE/USD is now above the 50 level.
Major support levels – USD 0.1280 and USD 0.1250.
Major resistance levels – $0.1340 and $0.1350.