
 positive indicators emerge, but recovery is still fragile")
Dogecoin started a recovery wave above the $0.120 zone against the US dollar. DOGE is now facing hurdles near USD 0.1280 and could struggle to continue higher.
- DOGE price started a recovery wave from USD 0.1150 and climbed above USD 0.120.
- The price is trading below the USD 0.130 level and the 100-hour simple moving average.
- There was a break above a key bearish trendline with resistance at $0.1240 on the hourly chart of the DOGE/USD pair (Kraken data source).
- The price could continue to rise if it remains above $0.120.
Dogecoin price faces resistance
Dogecoin price started a recovery wave from the $0.1150 zone, like Bitcoin and Ethereum. DOGE climbed above the USD 0.1180 and USD 0.120 resistance levels.
There was quite a bit of upside above the 23.6% Fib retracement level from the downward move from the $0.1512 swing high to the $0.1154 low. Additionally, there was a break above a key bearish trendline with resistance at $0.1240 on the hourly chart of the DOGE/USD pair.
The Dogecoin price is now trading below the $0.130 level and the 100-hourly moving average. If there is a recovery wave, immediate upside resistance will be around the $0.1260 level. The first major resistance for the bulls could be near the $0.1285 level.
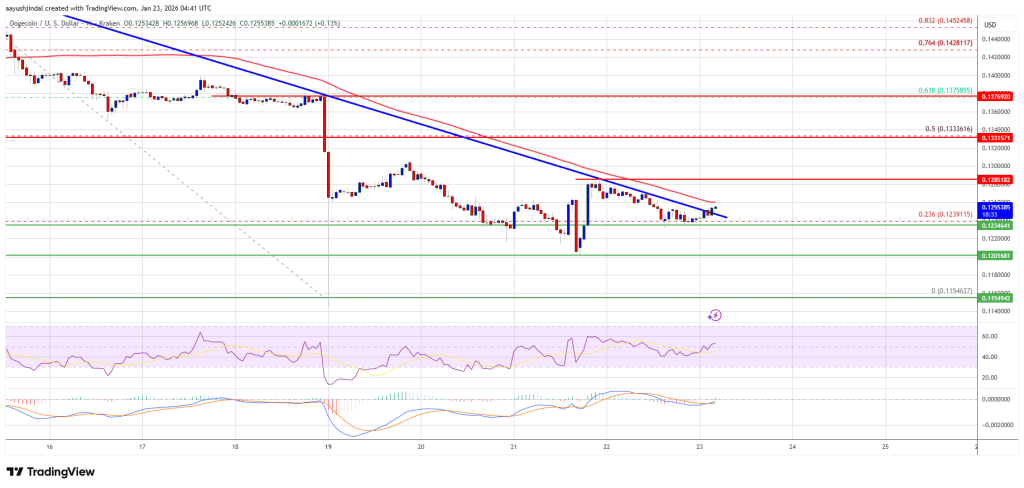
The next major resistance is near the $0.1330 level and the 50% Fib retracement level of the downward move from the $0.1512 swing high to the $0.1154 low. A close above the resistance at $0.1330 could send the price towards the resistance at $0.1420. Any further gains could send the price towards the USD 0.150 level. The next big stop for the bulls could be $0.1550.
Another drop in DOGE?
If DOGE price fails to rise above the USD 0.1280 level, it could continue to decline. The initial downside support is near the $0.1230 level. The next major support is near the $0.120 level.
The main support is at $0.1150. If there is a downside break below the USD 0.1150 support, the price could fall further. In the mentioned case, the price could slide towards the $0.1080 level or even $0.1050 in the short term.
Technical indicators
Hourly MACD – The MACD for DOGE/USD is now losing momentum in the bearish zone.
Hourly RSI (Relative Strength Index) – The RSI for DOGE/USD is now above the 50 level.
Major support levels – USD 0.1200 and USD 0.1150.
Major resistance levels – $0.1280 and $0.1330.