
 is strengthening as Altcoin Rally signals renewed risk appetite")
Dogecoin started a big rise above $0.10 against the US dollar. DOGE is now consolidating and could fall again if it fails to clear $0.1060.
- DOGE price started a new increase above USD 0.0950 and USD 0.10.
- The price is trading above the $0.10 level and the 100-hour simple moving average.
- There was a break above a bearish trendline with resistance at $0.0942 on the hourly chart of the DOGE/USD pair (Kraken data source).
- The price could aim for another increase if it remains stable above $0.0988.
Dogecoin Price Consolidates Gains
The Dogecoin price started to rise again after breaking above $0.0950, just like Bitcoin and Ethereum. DOGE climbed above the resistance at $0.0980 and entered a positive zone.
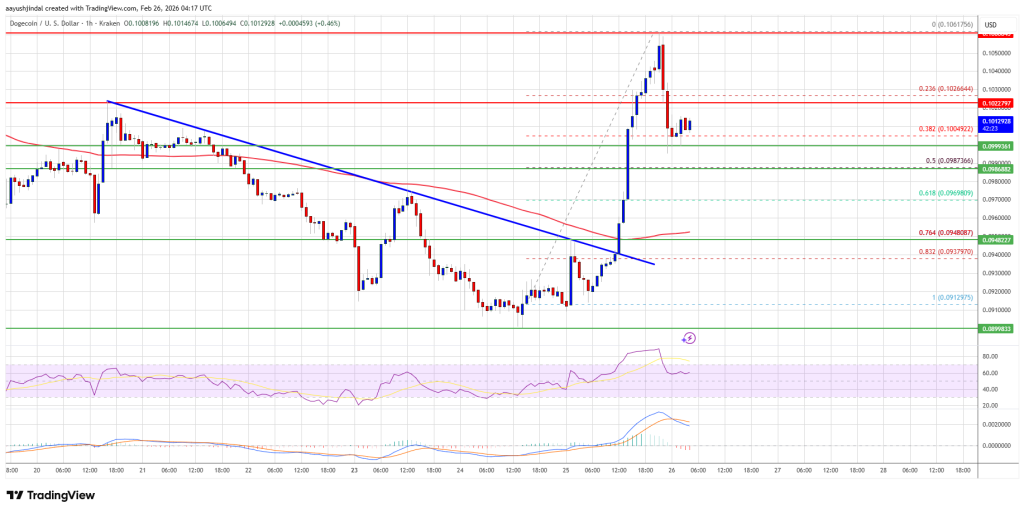
There was also a break above a bearish trendline with resistance at $0.0942 on the hourly chart of the DOGE/USD pair. The bulls managed to push the price above $0.10. A high was formed at $0.1061 and the price is now correcting some gains. There was a move below the 23.6% Fib retracement level of the upward move from the $0.0910 swing low to the $0.1061 high.
The Dogecoin price is now trading above the $0.10 level and the 100-hourly moving average. If another rise occurs, immediate upside resistance will be around the $0.1028 level. The first major resistance for the bulls could be near the $0.1050 level.
The next major resistance is near the $0.1080 level. A close above the resistance at $0.1080 could send the price towards $0.1120. Any further gains could send the price towards USD 0.120. The next big stop for the bulls could be $0.1220.
Another drop in DOGE?
If DOGE price fails to rise above the USD 0.1050 level, it could trigger a downside correction. The initial downside support is near the $0.10 level. The next major support is near the $0.0.988 level or the 50% Fib retracement level of the upward move from the $0.0910 swing low to the $0.1061 high.
The main support is at USD 0.0950. If there is a downside break below the USD 0.0950 support, the price could fall further. In the mentioned case, the price could slide towards the $0.0920 level or even $0.090 in the short term.
Technical indicators
Hourly MACD – The MACD for DOGE/USD is now losing momentum in the bullish zone.
Hourly RSI (Relative Strength Index) – The RSI for DOGE/USD is now above the 50 level.
Major support levels – $0.0988 and $0.0.950.
Major resistance levels – $0.1050 and $0.1120.