

Dogecoin (DOGE) traded at $0.14 on Friday, up 0.25% in the past 24 hours, according to market tickers. The weekly performance of the coin showed a decline of 7.40%. Trading activity has fallen sharply, with one source reporting a 50% drop in volume.
Key momentum readings and moving averages
According to market data DOGE The RSI is at 52.70 with a signal line at 52, indicating fairly balanced momentum and no obvious bias. Exponential moving averages are as follows: EMA 20 at $0.13, EMA 50 at $0.14, EMA 100 at $0.15 and EMA 200 at $0.17.
The EMA set shows a downward curve overall, and the EMA 50 is being closely watched as a short-term barrier. The coin’s market capitalization was $23.60 billion.
Analysts offer targets as the price makes a higher low
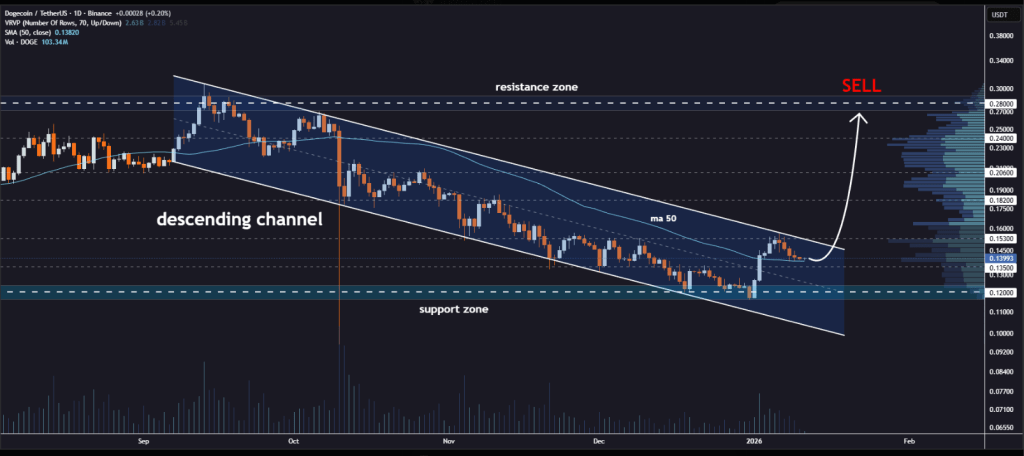
Crypto analyst Jonathan Carter set a ladder of upside targets at $0.15, $0.18, $0.20, $0.24 and $0.28, saying these levels match previous reaction points on the chart. Based on reports, Carter views price action above the 50-day moving average as an early sign of momentum returning.
#DOGE Breakout from sloping canal approaching
Dogecoin is about to break out of the descending channel formation on the daily chart
Price action above the MA 50 indicates a potential reversal of a long-term downtrend structure
Upward Objectives:
$0.153
— Jonathan Carter (@JohncyCrypto) January 11, 2026


DOGE has built higher lows, which would be a positive structure if it holds. Other analysts identified the all-time high at $0.73 as a long-term benchmark and noted a fourfold minimum growth target from current prices under the existing trend.
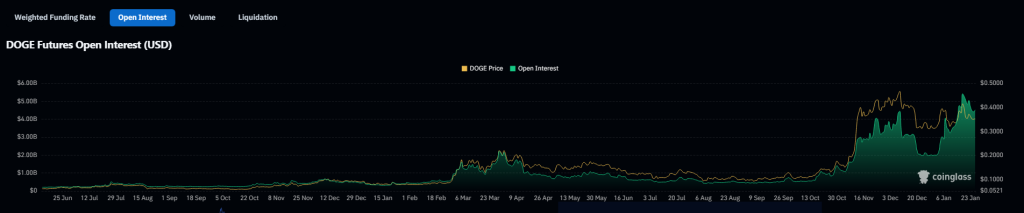
Open interest rises while volume falls
CoinGlass data showed in one report that trading volume fell 43% to $1.30 billion, while Open Interest rose 1.70% to $1.80 billion. The total number of liquidations in the last 24 hours was $596,000, with long positions at $431,000 and short positions at $165,000. This split indicates greater long exposure among leveraged traders at this time.
Market structure means that a clear step is needed
Traders are estimating several distinct levels. A sustained move above the EMA 50 at $0.14 could invite more buyers. Failure to hold the EMA 20 support at $0.13 would raise questions about near-term strength. Although momentum indicators are now neutral, a decisive break in either direction would likely be followed by sharper swings given low volume.
The current picture is mixed: signals of regained momentum are accompanied by decreasing volume and a downtrend at longer EMAs. Positions are being held, as evidenced by rising Open Interest, but many market participants appear to be waiting for confirmation. If buying pressure returns and volume recovers, the analyst targets mentioned above could come into focus. If not, the chart may remain within a tight range for some time.
Featured image from Unsplash, chart from TradingView