A popular cryptocurrency trader believes that a mid-cap altcoin project shows high growth potential.
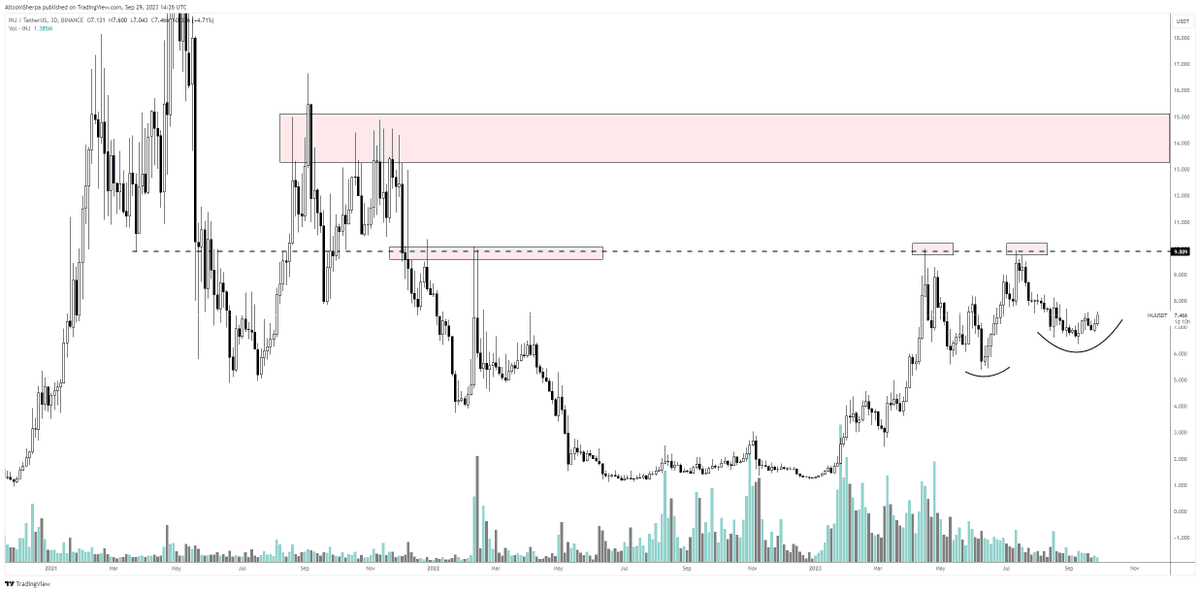
Pseudonymous crypto analyst Altcoin Sherpa tells his 196,400 followers on social media platform X, decentralized derivatives exchange Injective (INJ), are forming a bullish pattern.
“INJ: high timeframe higher low [price] is here. This looks very healthy.
I think this is one of the few that you can blindly buy dips for in the coming weeks.”

Looking at his chart, the trader seems to think that INJ is in an uptrend and may eventually retest the resistance level at $9.88 and then $14.
Injective is trading at $7.50 at the time of writing, up 3.3% in the last 24 hours.
The trader too weighs in on Bitcoin (BTC) and Ethereum (ETH), the largest crypto assets are predicted to likely see a significant rebound soon, based on a historical pattern.
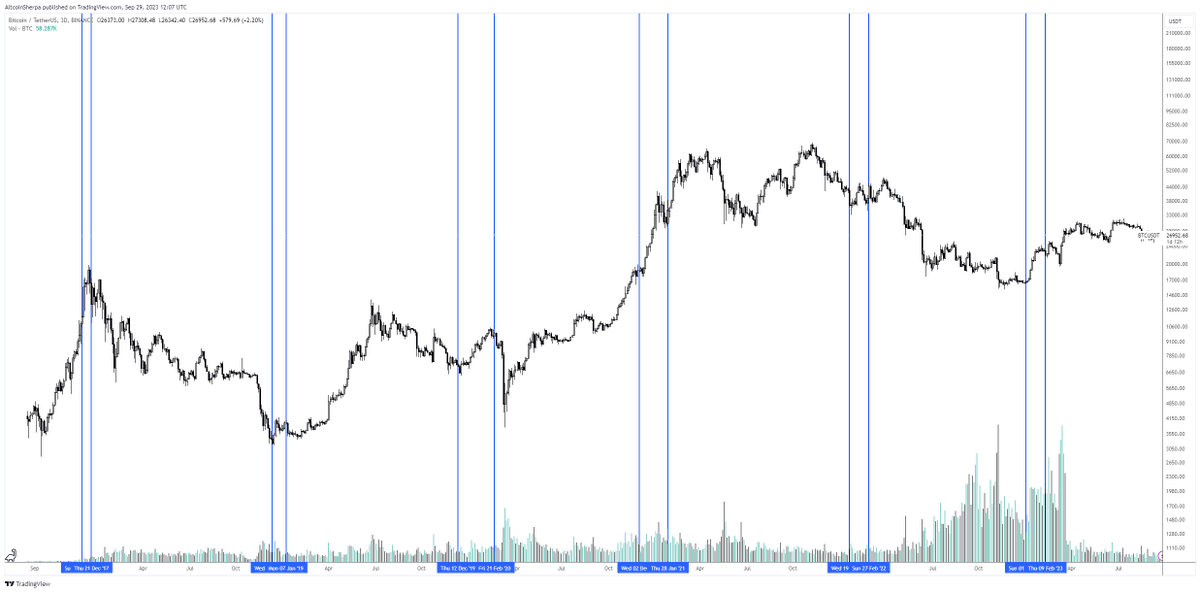
“Seasonality is very important to look for in crypto. BTC and ETH traditionally do extremely well sometime in the fourth quarter or first quarter of the following year.
It makes sense that people sell their stuff in December and buy it again in January. This happens even in the worst bear markets.”

Looking at his chart, the trader identifies the times when he believes BTC followed the seasonal sell-off and rally pattern, with the last two peaks occurring in late 2022 and early 2023.
Bitcoin is trading at $26,904 at the time of writing, down 0.7% in the past 24 hours.
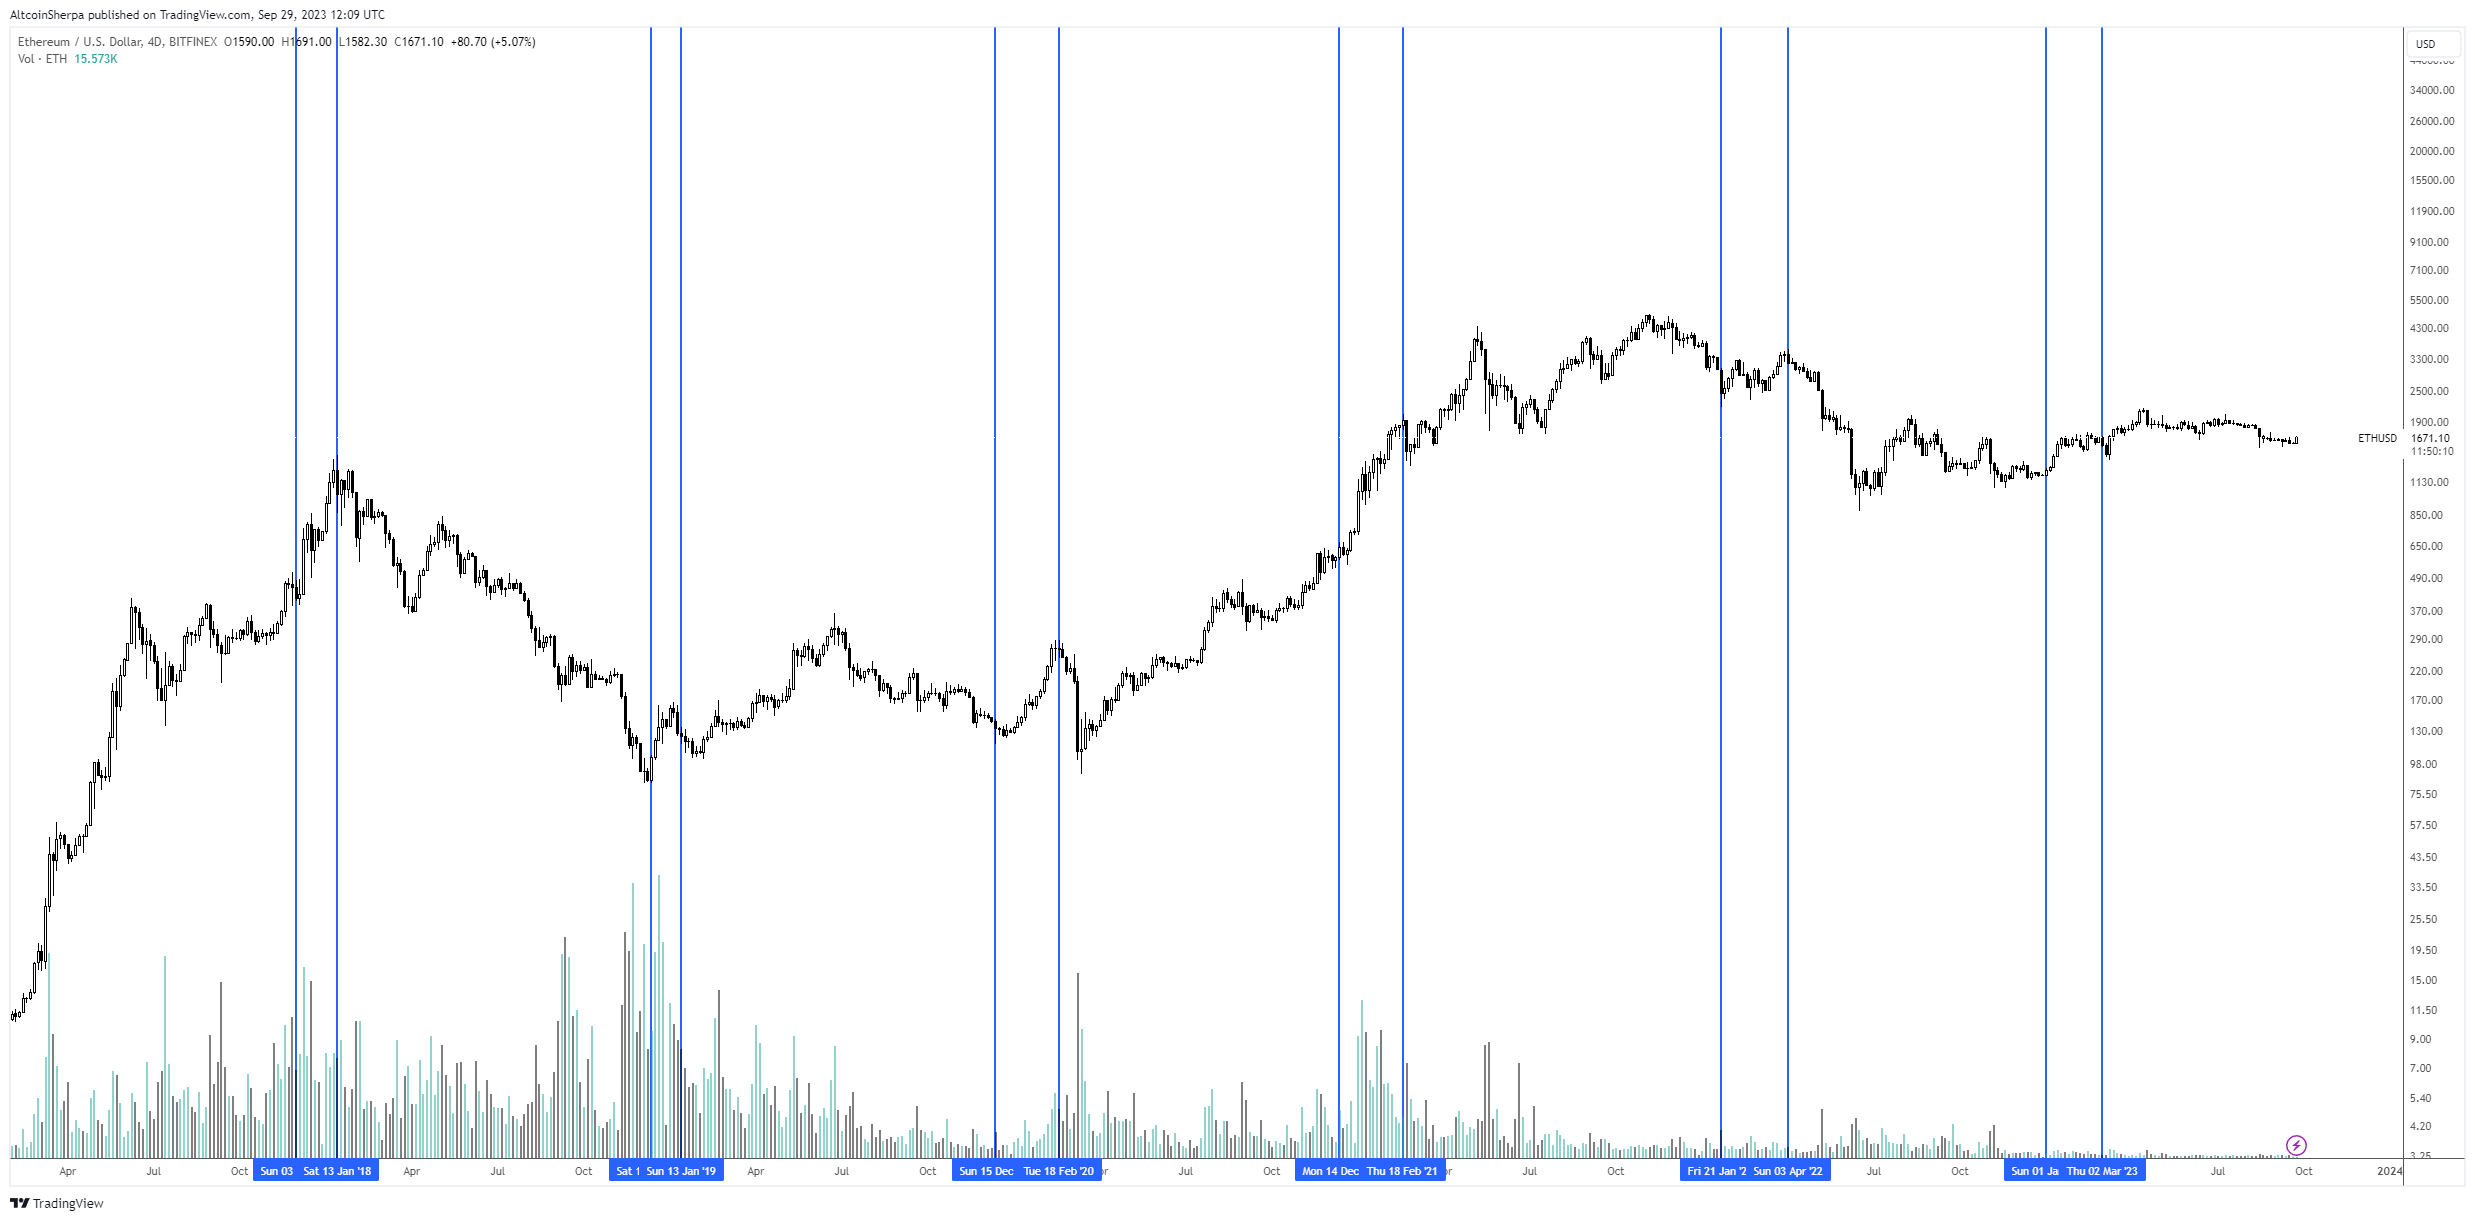
The trader also looks at Ethereum’s seasonality, to predict an ETH rally in the coming months.
“ETH is also really outspoken. Sometimes the rally takes place in December, sometimes in January, sometimes in November.
But usually it’s a strong rally that lasts about a month and in that time we get some mini altcoin runs. Personally, I will be longing for November.”

Ethereum is trading at $1,666 at the time of writing, up 0.5% in the past 24 hours.
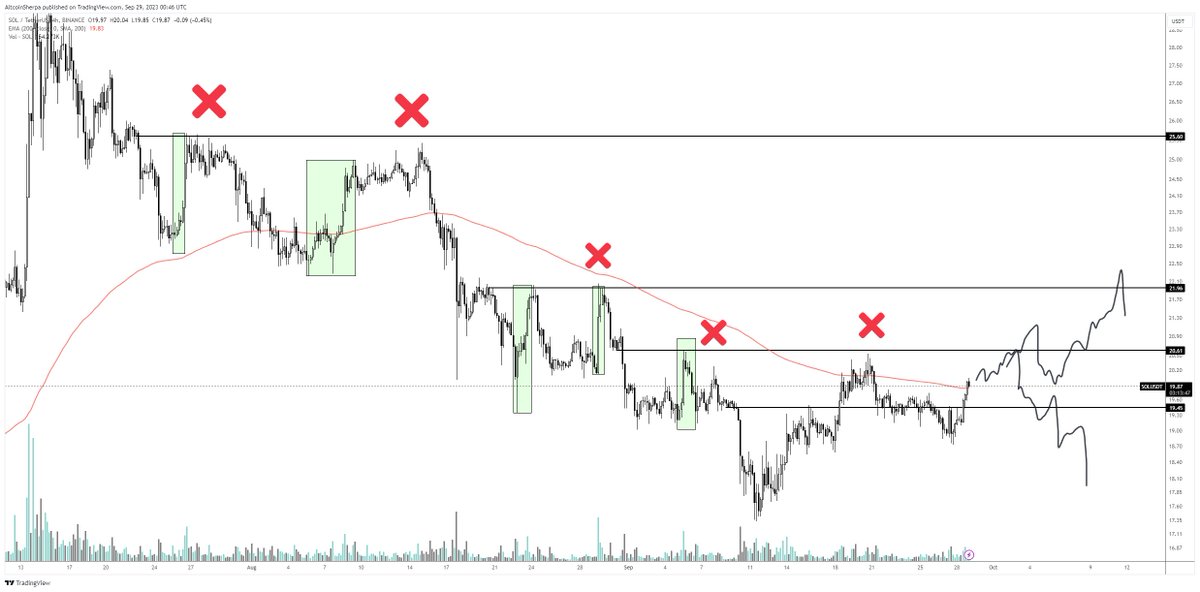
Finally, the trader say Solana is once again testing a key resistance level, but it remains unclear whether SOL will manage to convert this into support.
“SOL: Not a great place to buy here in my opinion, [retesting] the 200-day EMA (exponential moving average) at the 4-hour mark [chart], but I think it will be very interesting to see where the next peak is reached. There could be a shift in market structure if we hit a higher high at the 4-hour mark [chart]. Watching but not enthusiastic yet.”

Based on his chart, the trader seems to think that a bullish scenario would send SOL into the $21 range before a dip, while his bearish scenario sees SOL move back into the low $17 range.
Solana is trading at $20.24 at the time of writing, up 2.7% in the last 24 hours.
Don’t miss a beat – Subscribe to receive email alerts straight to your inbox
Check price action
follow us on Tweet, Facebook And Telegram
Surf to the Daily Hodl mix
Generated image: Midjourney
