

- A bullish flag pattern appeared on the weekly altcoin market cap chart.
- The Bitcoin rainbow chart suggested that BTC was in the ‘still cheap’ phase.
The crypto market has seen several upswings this year, but none of them lasted long. Most of these price increases were followed by corrections. However, things may be different in the last quarter of the year.
This appeared to be the case as several factors indicated a long-term bull cycle, which had the potential to push the market to new highs. Let’s take a closer look at what signaled a crypto bull run in the coming months.
Will Bitcoin Lead the Next Crypto Bull Run?
Bitcoin [BTC] surprised investors this year as it managed to reach an all-time high of over $72,000 in the first quarter. Ethereum [ETH]the king of altcoins, also gained bullish momentum during that time but failed to test its ATH by a huge margin.
Nevertheless, BTC quickly fell from that level and has struggled somewhat. In the last 24 hours alone, the price of BTC fell by 5% and it was trade for $59,097.36.
ETH’s fate was similar as it witnessed a 7% price drop. At the time of writing, ETH was valued at $2,458.85.
However, the coming months could be different as BTC may be planning a massive rally if historical data is to be believed. Bitcoin has always gained bullish momentum after a few months of halving.
In fact, BTC has always reached an ATH after the halving. To be precise, after BTC’s second halving on July 9, 2016, BTC turned bullish and reached an ATH in December 2017.
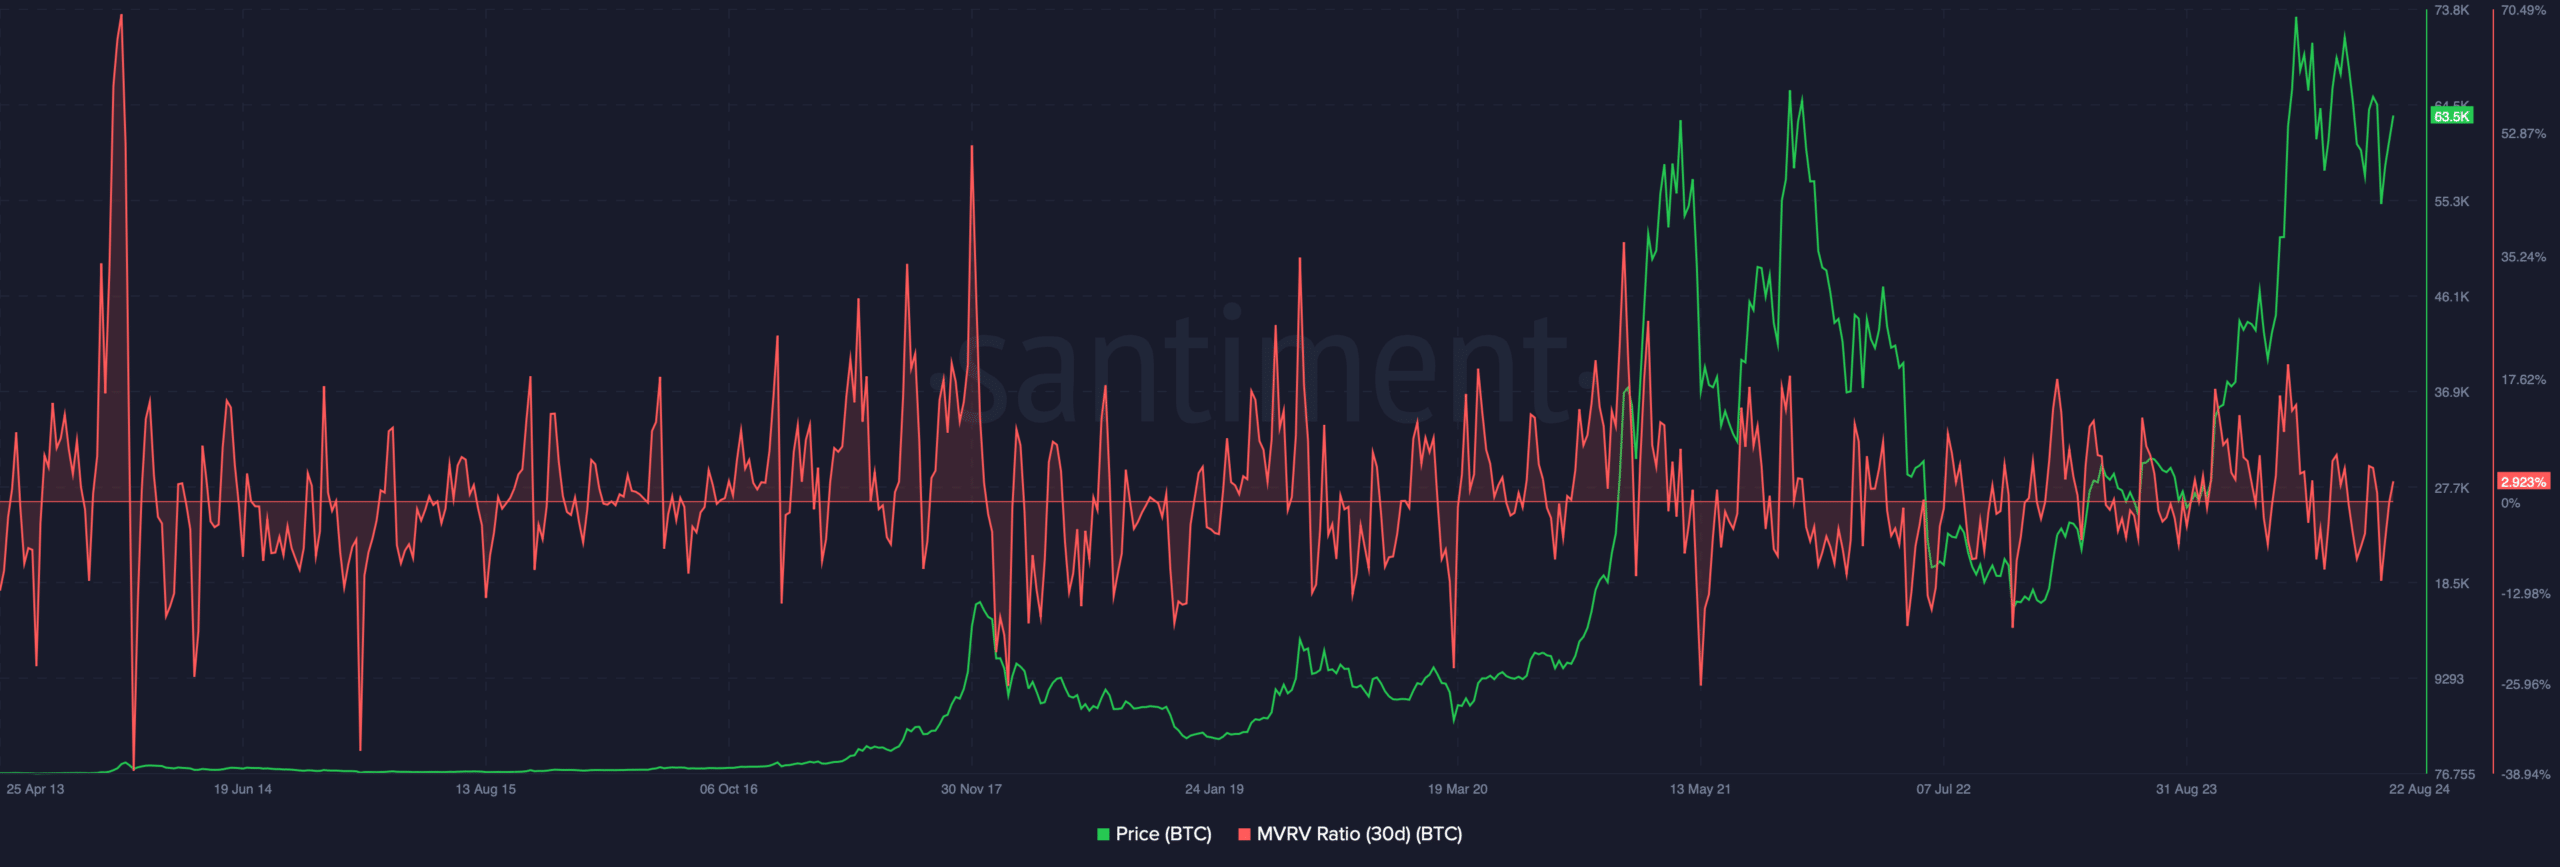
Source: Santiment
Similarly, after the third halving on May 11, 2020, BTC gained bullish momentum in October 2020 and reached an ATH a few months later. Since the last BTC halving took place in April 2024, there was a good chance that BTC would show a bull run in the fourth quarter of 2024.
Another interesting metric to keep an eye on is the MVRV ratio. If we look closely at the statistic, it appears that it exceeds 30% every time BTC reaches an ATH.
At the time of writing, BTC’s MVRV ratio stood at 2.92%. This clearly suggested that BTC was waiting for a price increase in the coming months.
Apart from that, AMBCrypto’s look at the Bitcoin Rainbow Chart revealed that BTC was in the “still cheap” phase. This indicator also suggested that investors should consider buying the coin before it turns bullish.
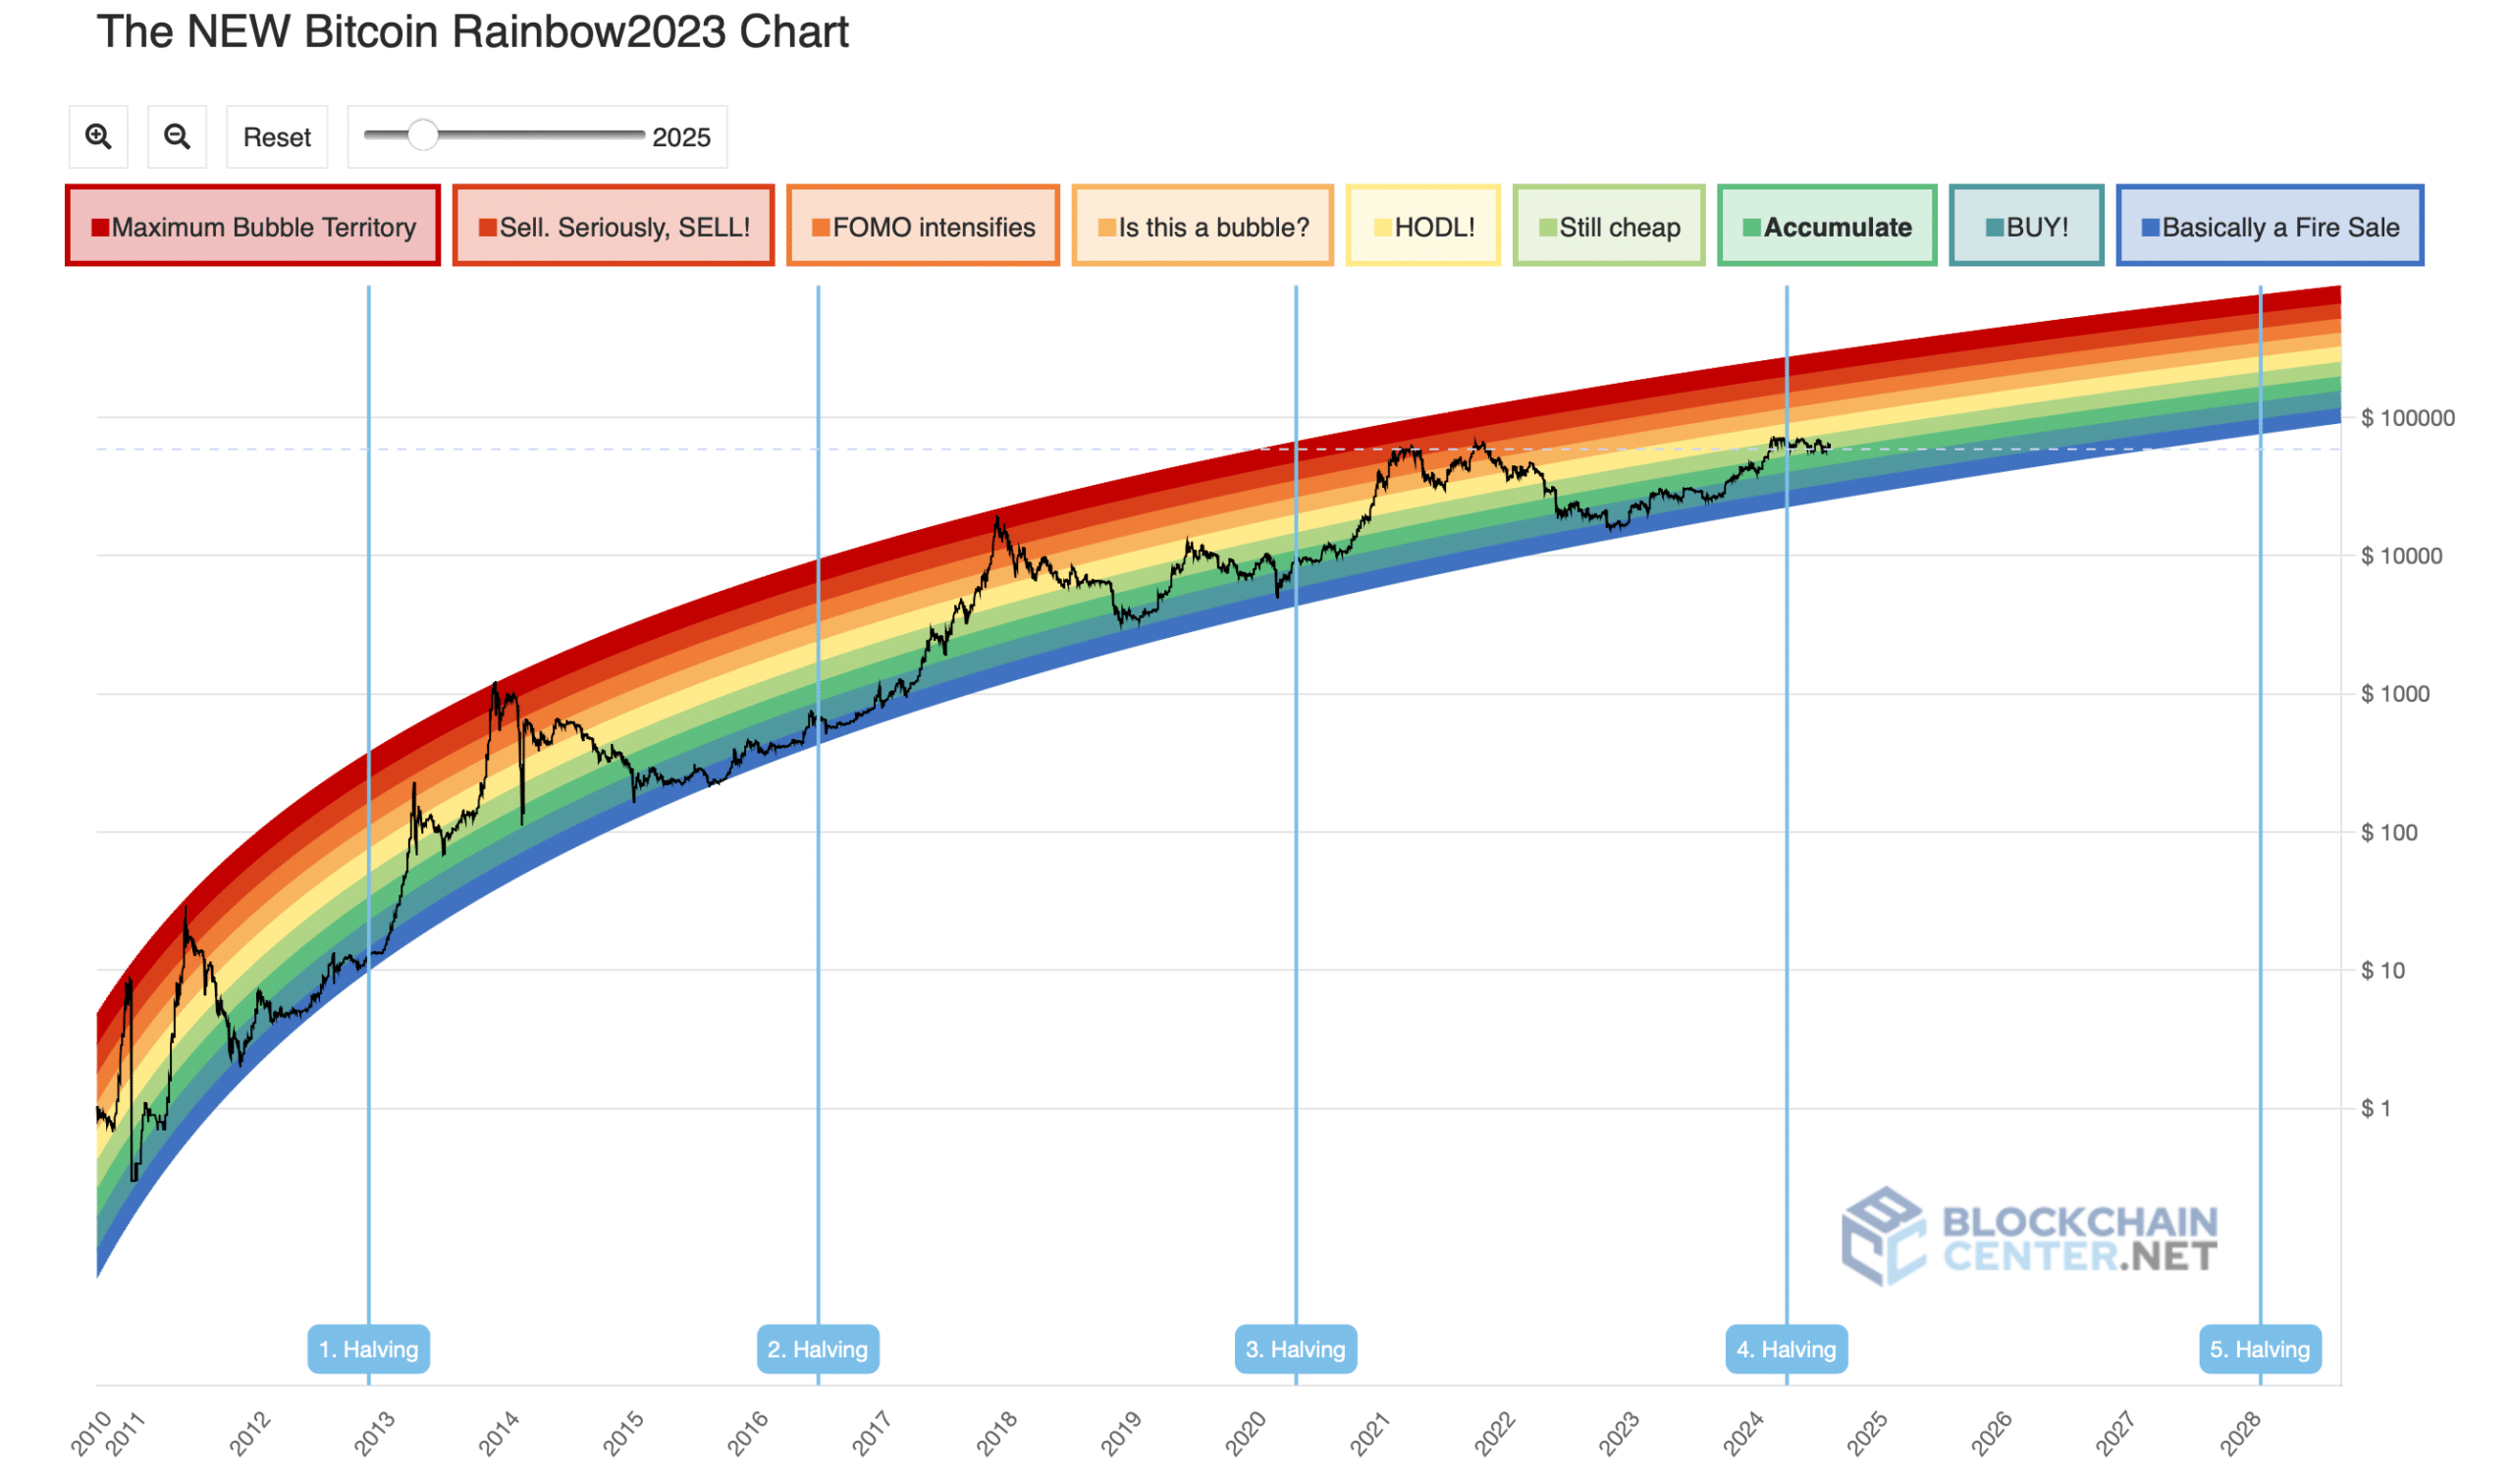
Source: Blockchaincenter
Altcoins are also planning a rally soon
In general, the market tends to follow BTC as it is the largest cryptocurrency. Therefore, in the event of a bullish BTC breakout, the chances of altcoins also turning bullish were high.
Nevertheless, altcoins also have a trick up their sleeve that signals a bull run. AMBCrypto’s look at the weekly altcoin market cap chart revealed a bullish flag pattern.
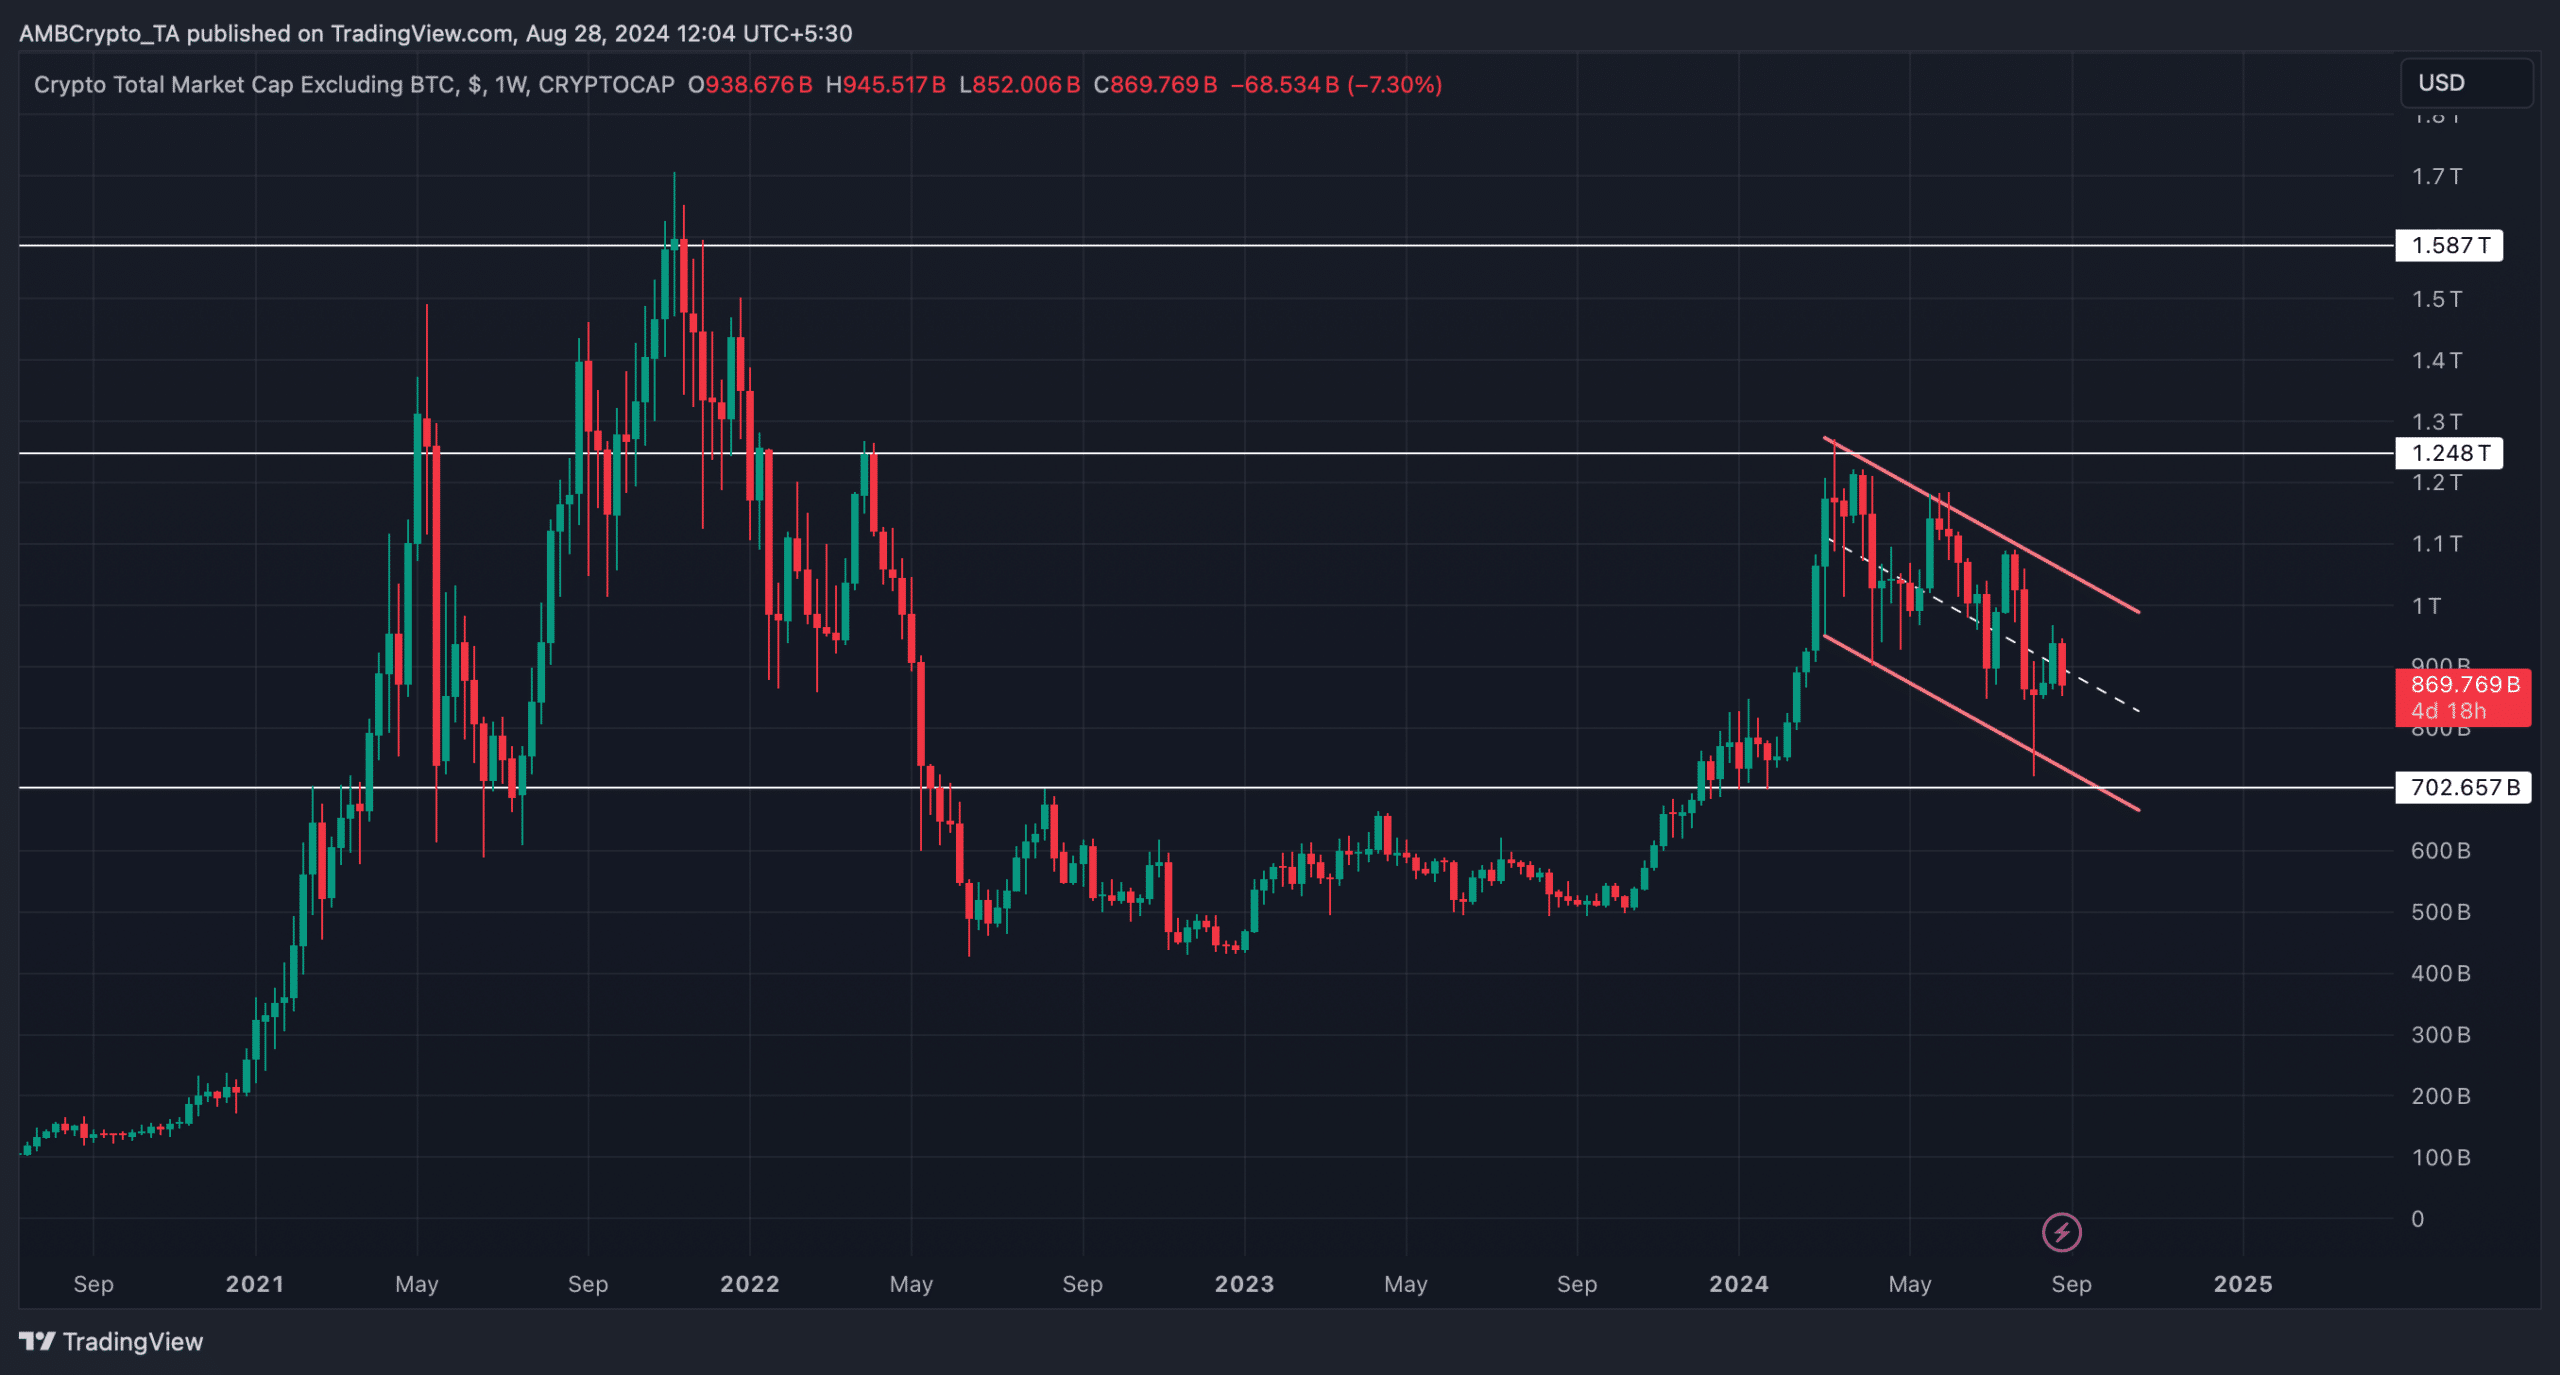
Source: TradingView
The bullish pattern emerged in March and since then the market capitalization of altcoins has been consolidating within it. If a bullish breakout occurs in the coming months, investors will witness a major increase in the market capitalization of altcoins.
In fact, a breakout could allow the altcoin market cap to regain $1.24 trillion before it begins its journey to its $1.58 trillion ATH.
However, in the short term, things might not be good as there was a chance that the market cap would fall to the support level of $702 billion. At that level, the market cap chart could recover and move towards the upper limit of the bullish flag pattern.
The altcoin seasonal index remained in BTC’s favor as it reached a reading of 24. A number closer to or higher than 75 indicates an altcoin season.
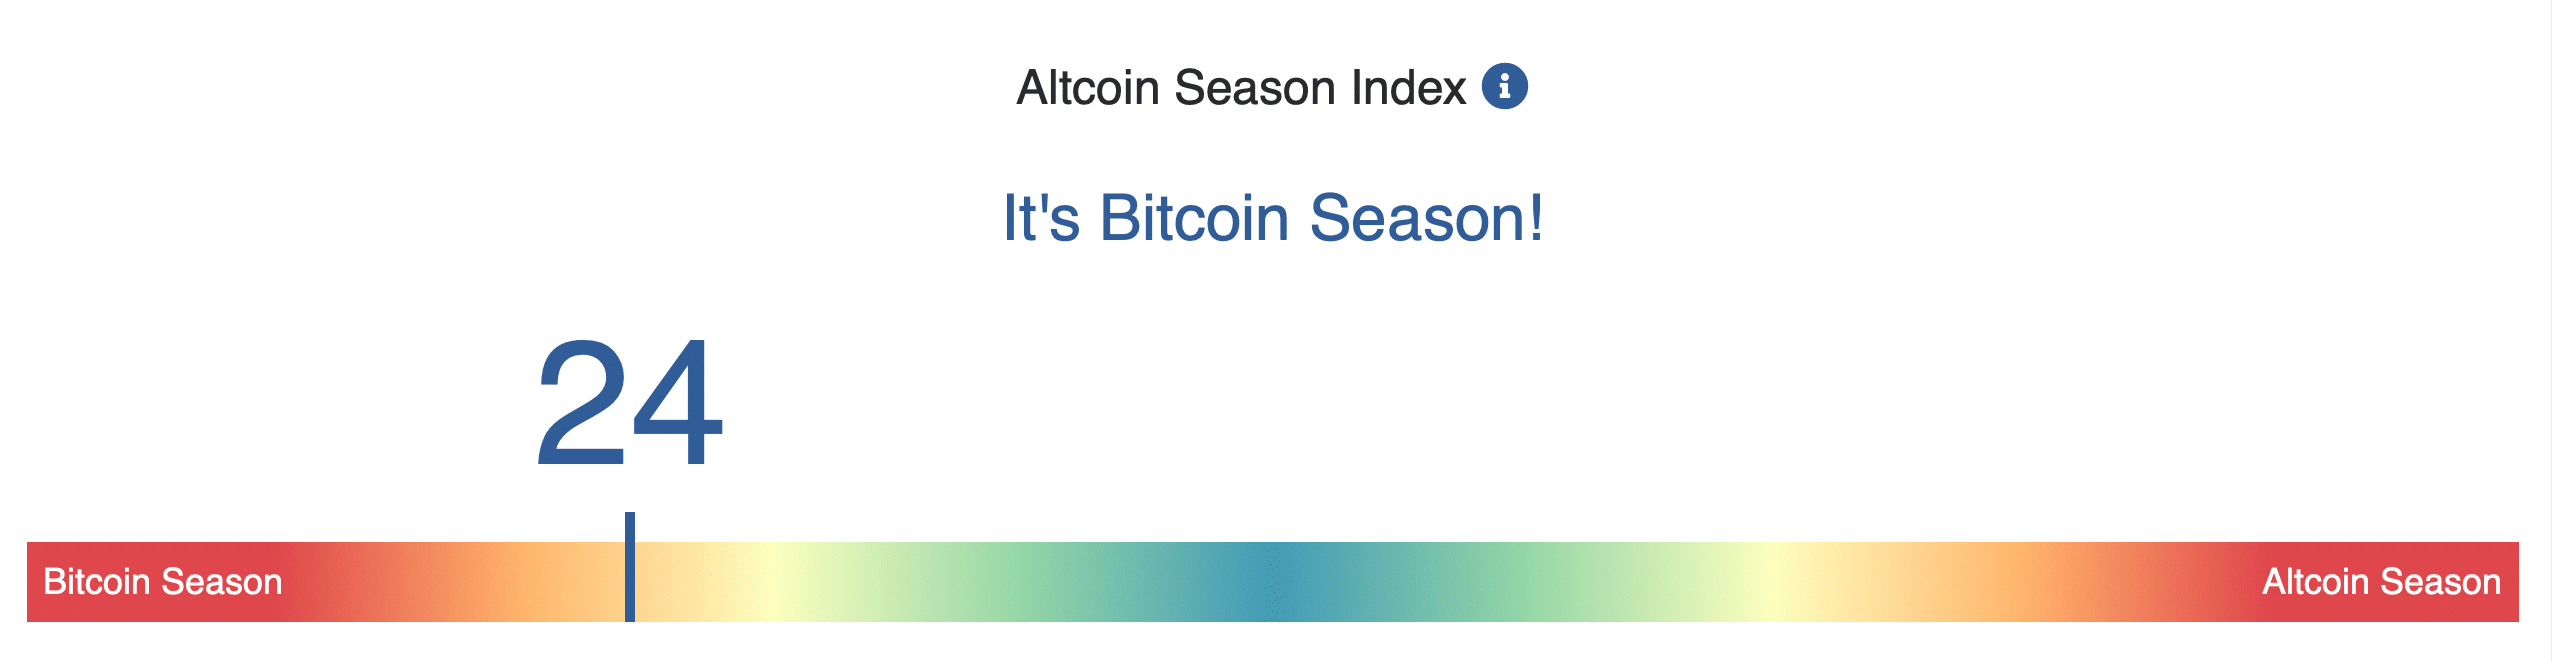
Source: Blockchaincenter
Why memecoins have great potential
While most eyes have been on top cryptos like BTC and ETH, investors should not disparage memecoins as these cryptos have shown promising performance in recent months.
Apart from top memes like Dogecoin [DOGE] And Shiba Inu [SHIB], Solana [SOL]-based memecoins have gained a lot of traction lately.
Read Bitcoin’s [BTC] Price forecast 2024–2025
For reference, dog hat [WIF] has shown a price increase of more than 800% since its founding in 2024. POPCATone of the newest additions to SOL’s meme ecosystem, performed even better, as its value increased by 4,184% since launch.
Therefore, while we keep an eye on the performance of top market cap cryptos, it will also be crucial to see how the namecoin market fares during the next crypto bull run.