

- TIA has a bullish outlook in the near term, but could see a small retracement.
- A return to the USD 5.6 and USD 5.8 support levels would provide a buying opportunity.
Celestia [TIA] has been on a good bullish run this past week and traders expect this trend to continue next week. AMBCrypto’s analysis of the liquidation charts showed that a small price drop was possible over the weekend.
The higher timeframe charts showed momentum was bearish, but increased trading volume pointed toward increased bullish conviction. A move to $8 is likely based on the available evidence.
The defense at 100% Fibonacci retracement level leads to a big rally
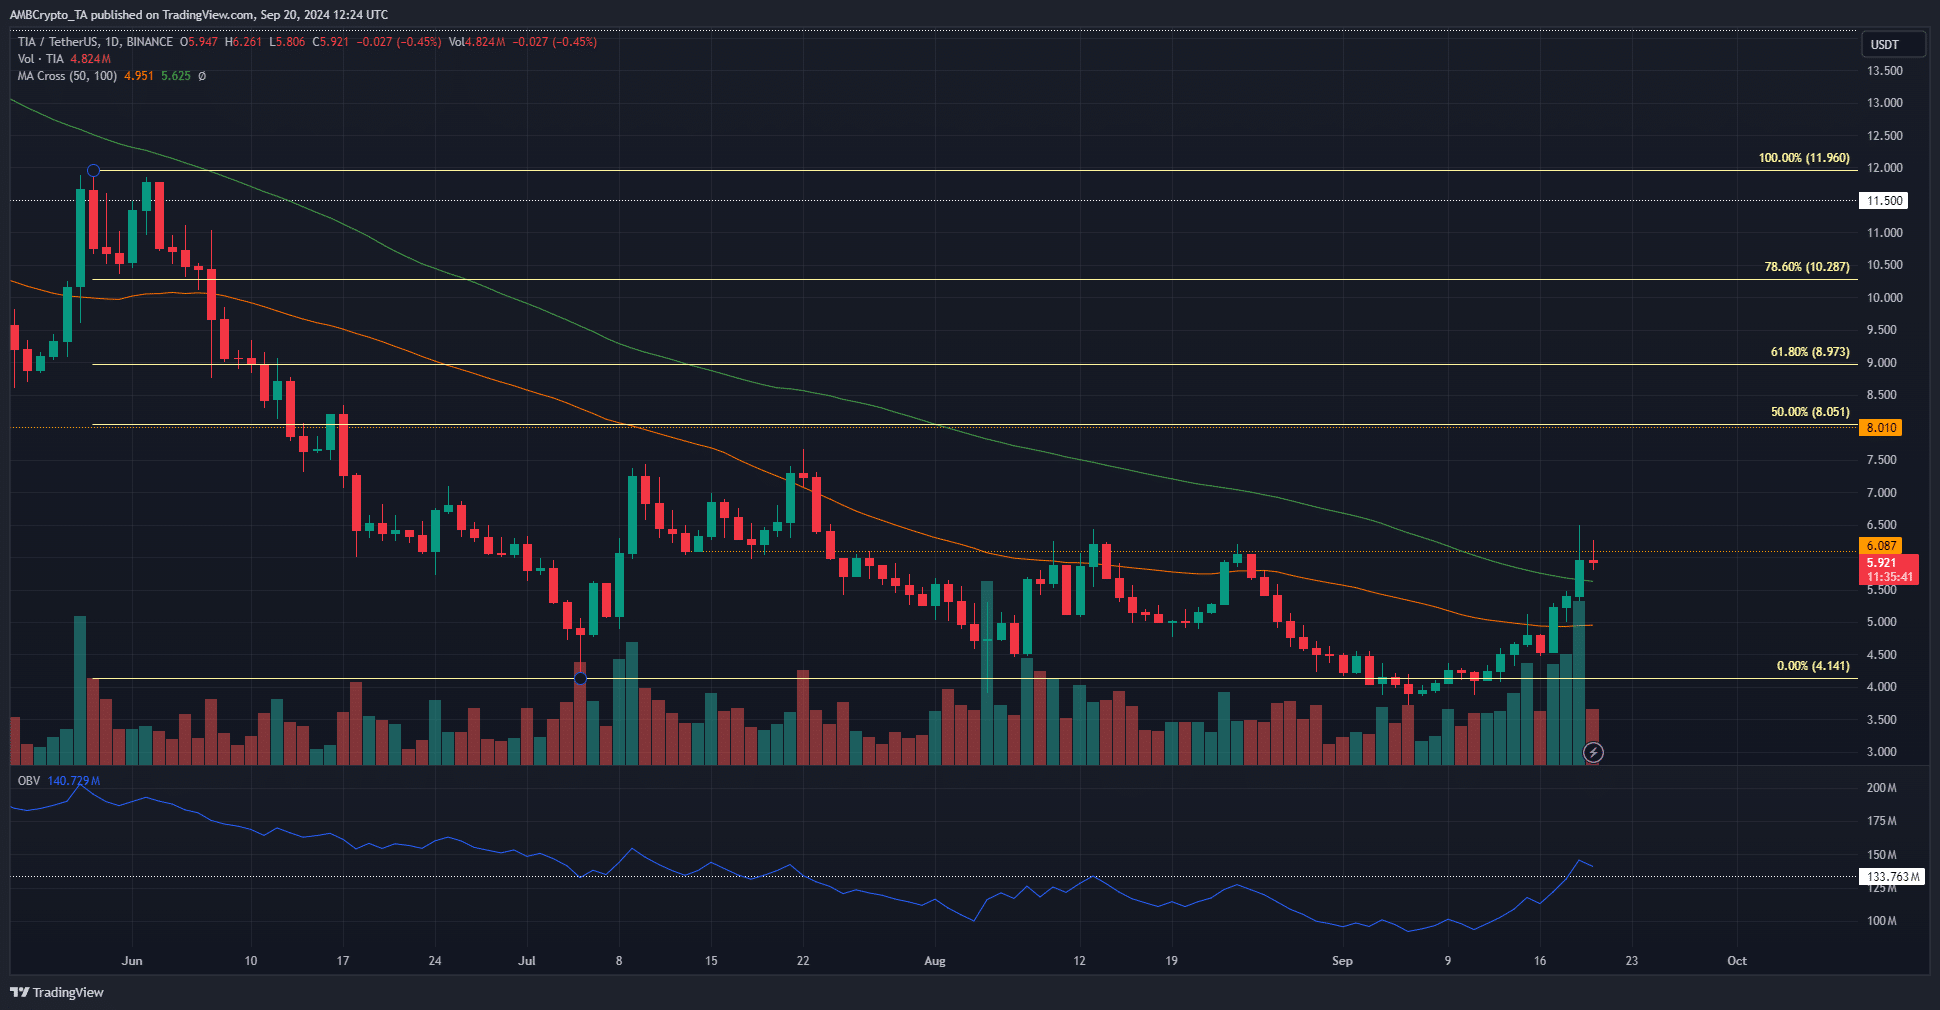
Source: TIA/USDT on TradingView
The most recent lower high was $6,194. On September 19, TIA reached $6,498 but was unable to close a daily trading session above $6,194. This meant that the market structure was not reversed bullishly.
Given the increasing trading volume in recent days, it seemed only a matter of time. Accordingly, OBV also rose above local highs in August. This suggested that the price would soon follow suit and break the USD 6.2 resistance zone.
The simple moving averages over the 20 and 50 periods showed that the long-term momentum was bearish as they have not yet crossed the line. Celestia crypto price has crossed both moving averages, showing that short-term momentum has been bullish.
Objectives for the current momentum rally
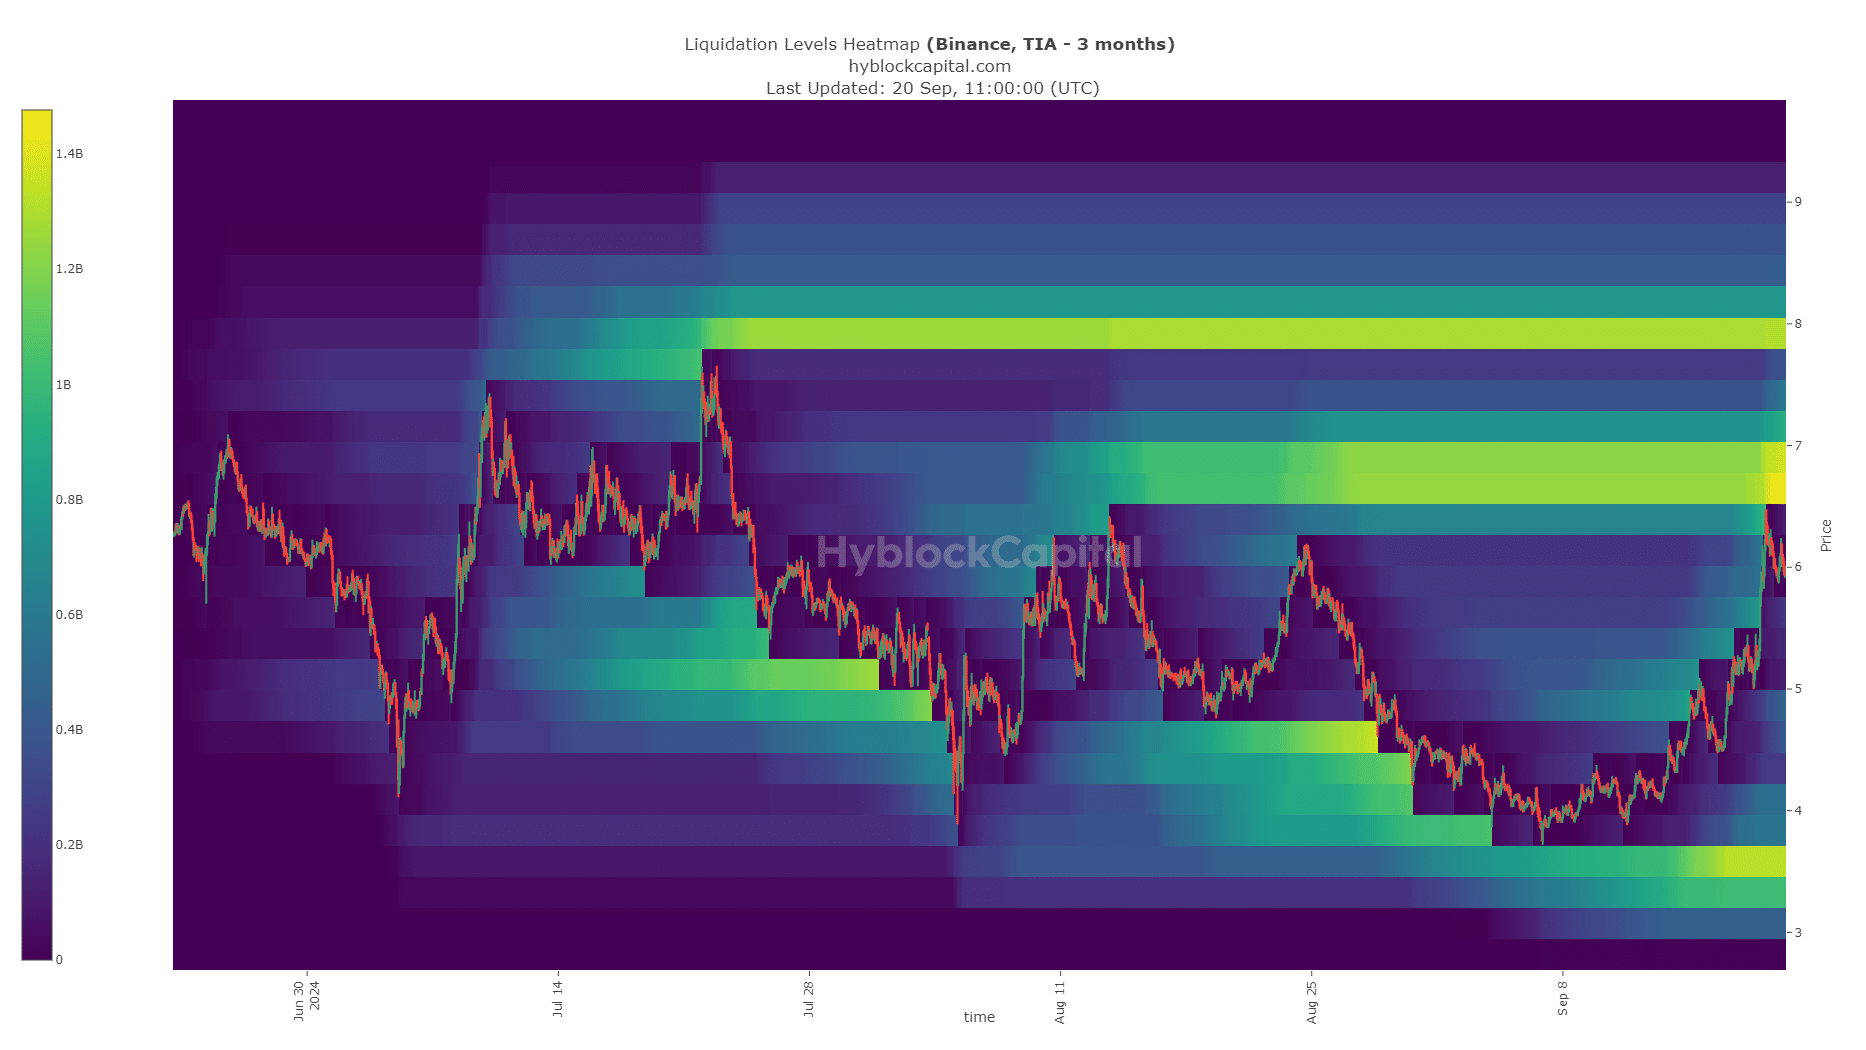
The rapid Celestia crypto wave of the past has been building for ten days and recorded most of its gains within three days. The liquidation heatmap showed that $7 and $8 were the next magnetic zones.
Prices are attracted to these pockets of liquidity and may see a bearish reversal. It seemed likely that TIA would move higher towards $8 instead of being rejected at $7 due to trading volume over the past few days.
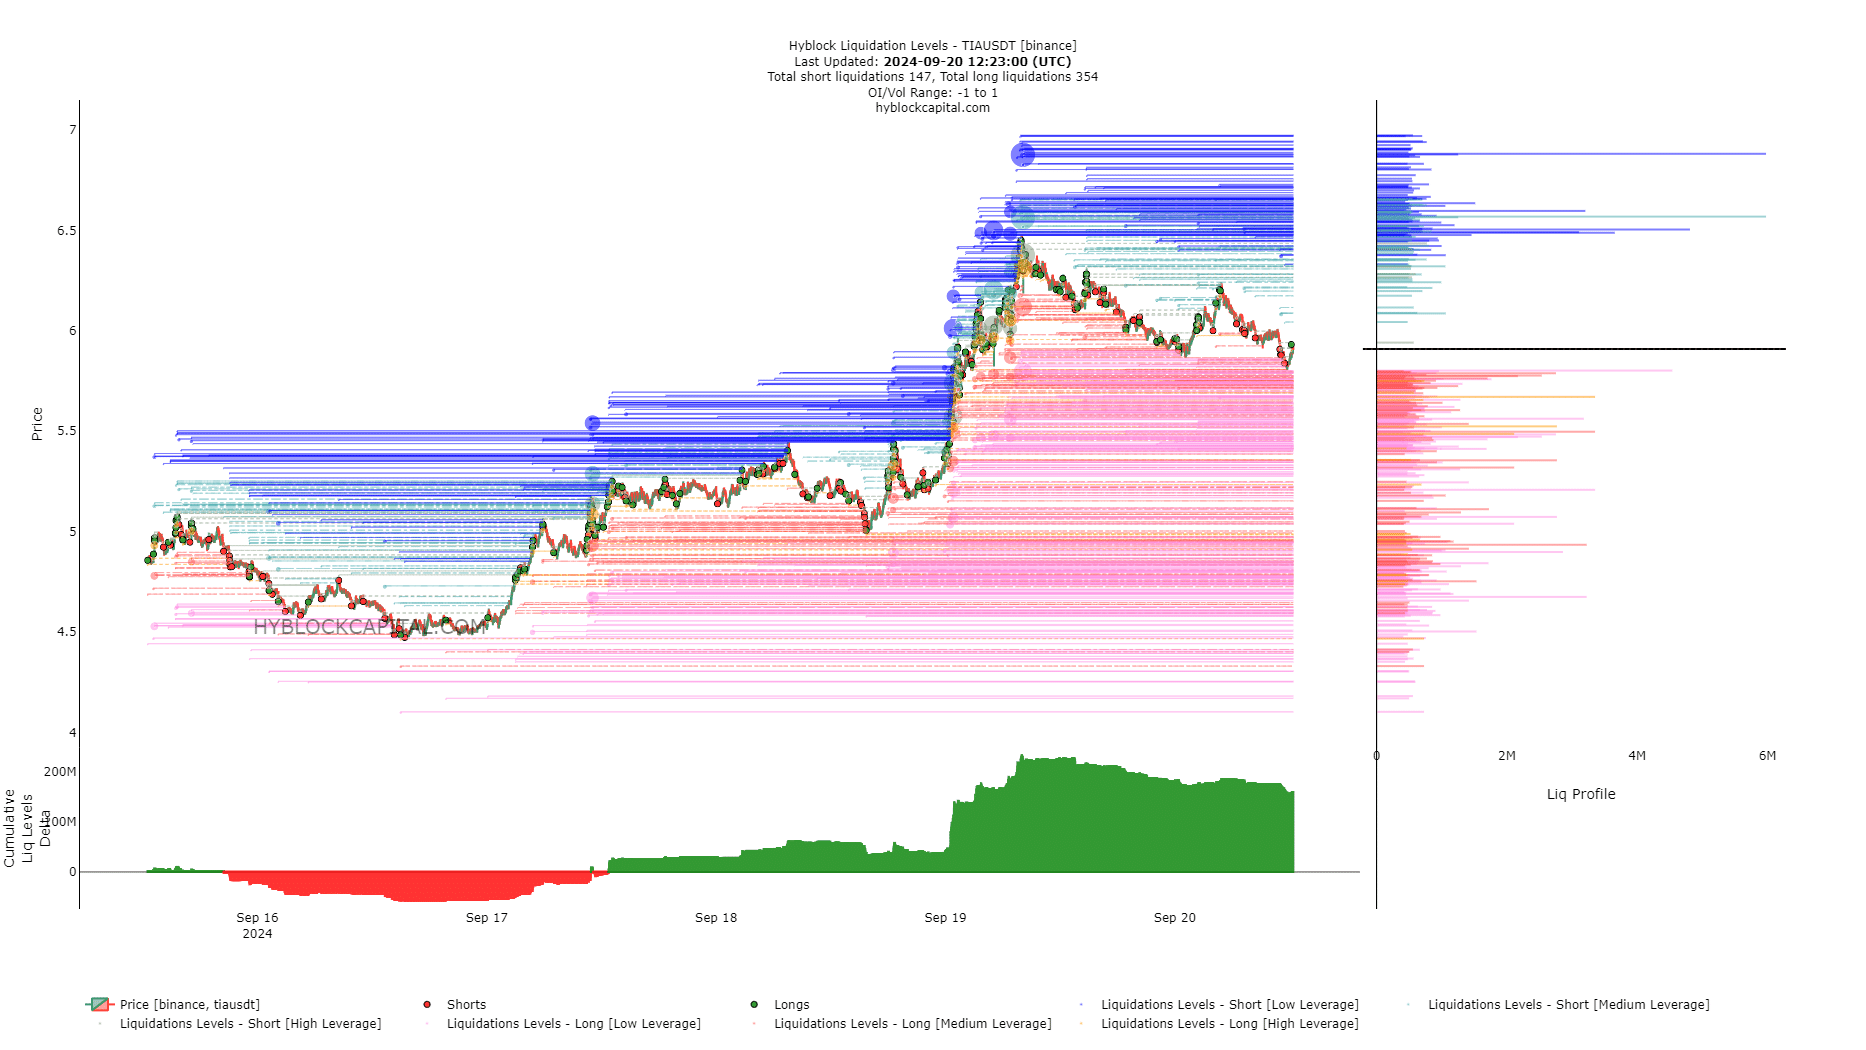
AMBCrypto analyzed the liquidation levels chart to see if traders could expect short-term price volatility. It seemed they had to be wary of a price drop as the cumulative delta of liq levels was positive.
Read Celestia’s [TIA] Price forecast 2024-25
The long positions were disproportionately high, which could drive prices down and liquidate the late bulls. The liq levels chart showed that $5.8 and $5.6 are short-term support levels where the dip could end and Celestia crypto continues its upward move.
Disclaimer: The information presented does not constitute financial advice, investment advice, trading advice or any other form of advice and is solely the opinion of the writer