

- ADA’s trading volume rose sharply while its price fell
- A number of numbers and indicators pointed to a bull rally on the charts
Like most cryptos, Cardano [ADA] also had a good last 24 hours as the daily chart turned green after a few days. However, there could be better news, especially since ADA could be on the verge of a bullish breakout if a few conditions are met.
Let’s see what ADA needs to do to stay bullish on the price charts.
Cardano sees more green
Before the most recent surge, Cardano’s price had fallen by more than 9% in just seven days. However, things got better in the last 24 hours as the token’s price rose by more than 6%.
At the time of writing, Cardano was trading at $0.3552 with a market cap of over $12.7 billion.
And yet, IntoTheBlock’s data showed that more than 75% of investors were still out of money, accounting for 3.37 million ADA addresses.
Here it is also worth noting that the price drop also negatively affected the MVRV ratio. Trading volume increased during the price drop – usually considered a negative signal.
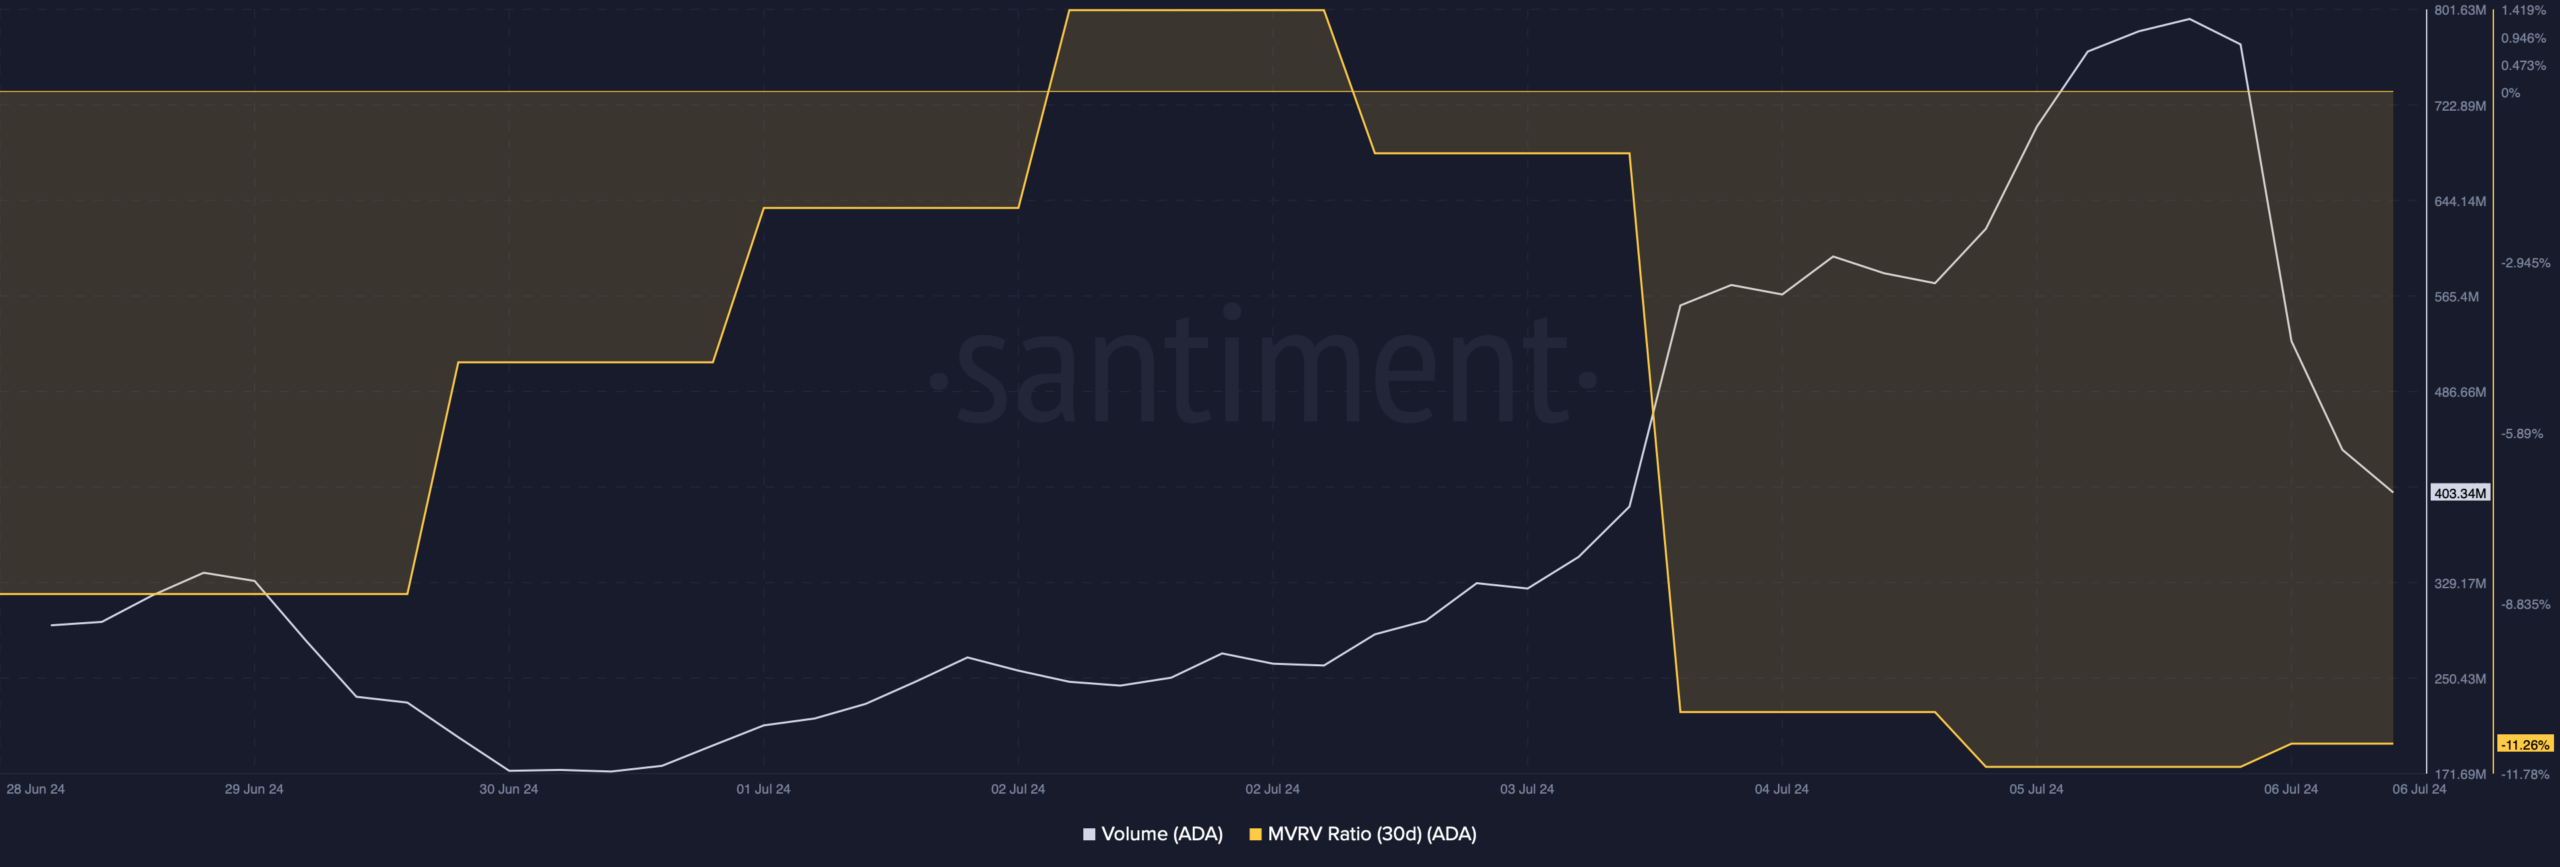
Source: Santiment
However, all these statistics and the market situation could take a turn if a bullish pattern appears on the token’s 12-hour chart.
According to AMBCrypto’s analysis, Cardano’s price has been consolidating within a falling wedge pattern since March. At the time of writing, it was about to test the lower bound of the pattern.
In order for ADA to trigger a bull rally, it needs to paint 3 to 4 green candlesticks. If that happens, it won’t be surprising to see the ADA bulls post huge gains, allowing them to retest the March highs in the coming weeks or months.
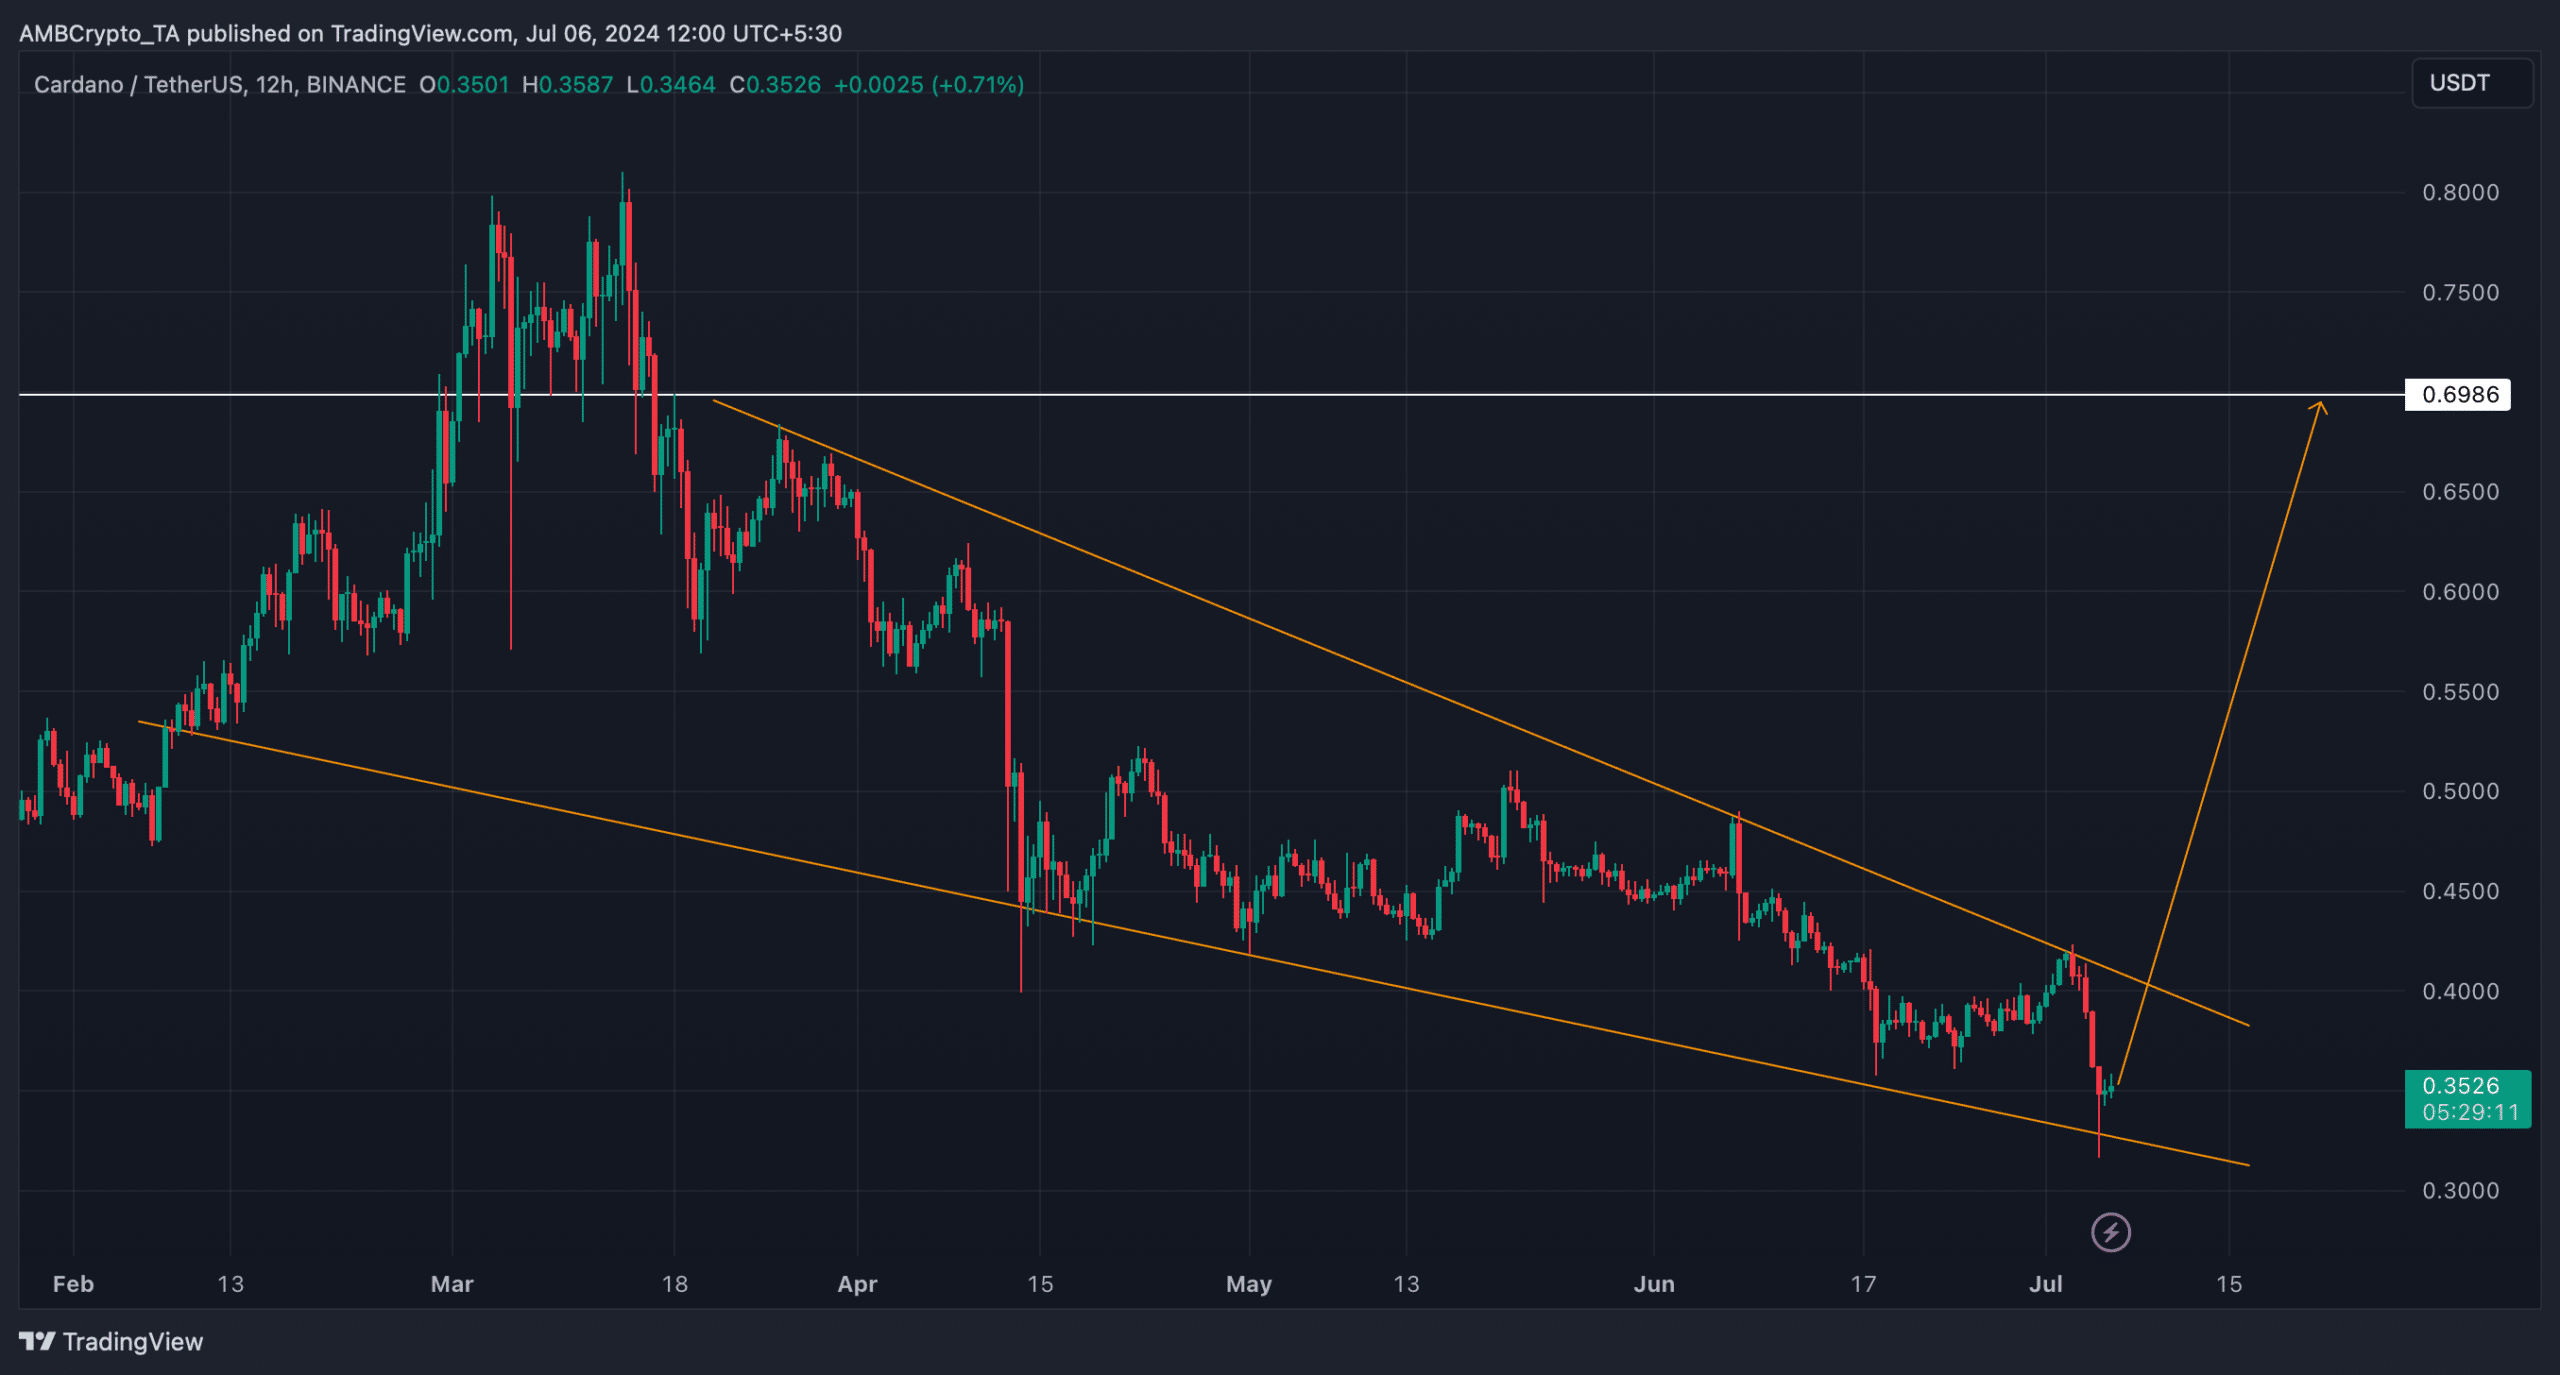
Source: TradingView
There is a good chance that ADA will break out
When AMBCrypto looked at Hyblock Capital’s data, an interesting relationship could also be seen.
According to our analysis, whenever ADA’s Cumulative Liquidation Level Delta turns green, the price of ADA increases. Likewise, when the metric turns red, the price of the token drops.
Although the metric was in the red, the figure was declining at the time of writing. Simply put, ADA could soon initiate a bull rally on the charts.
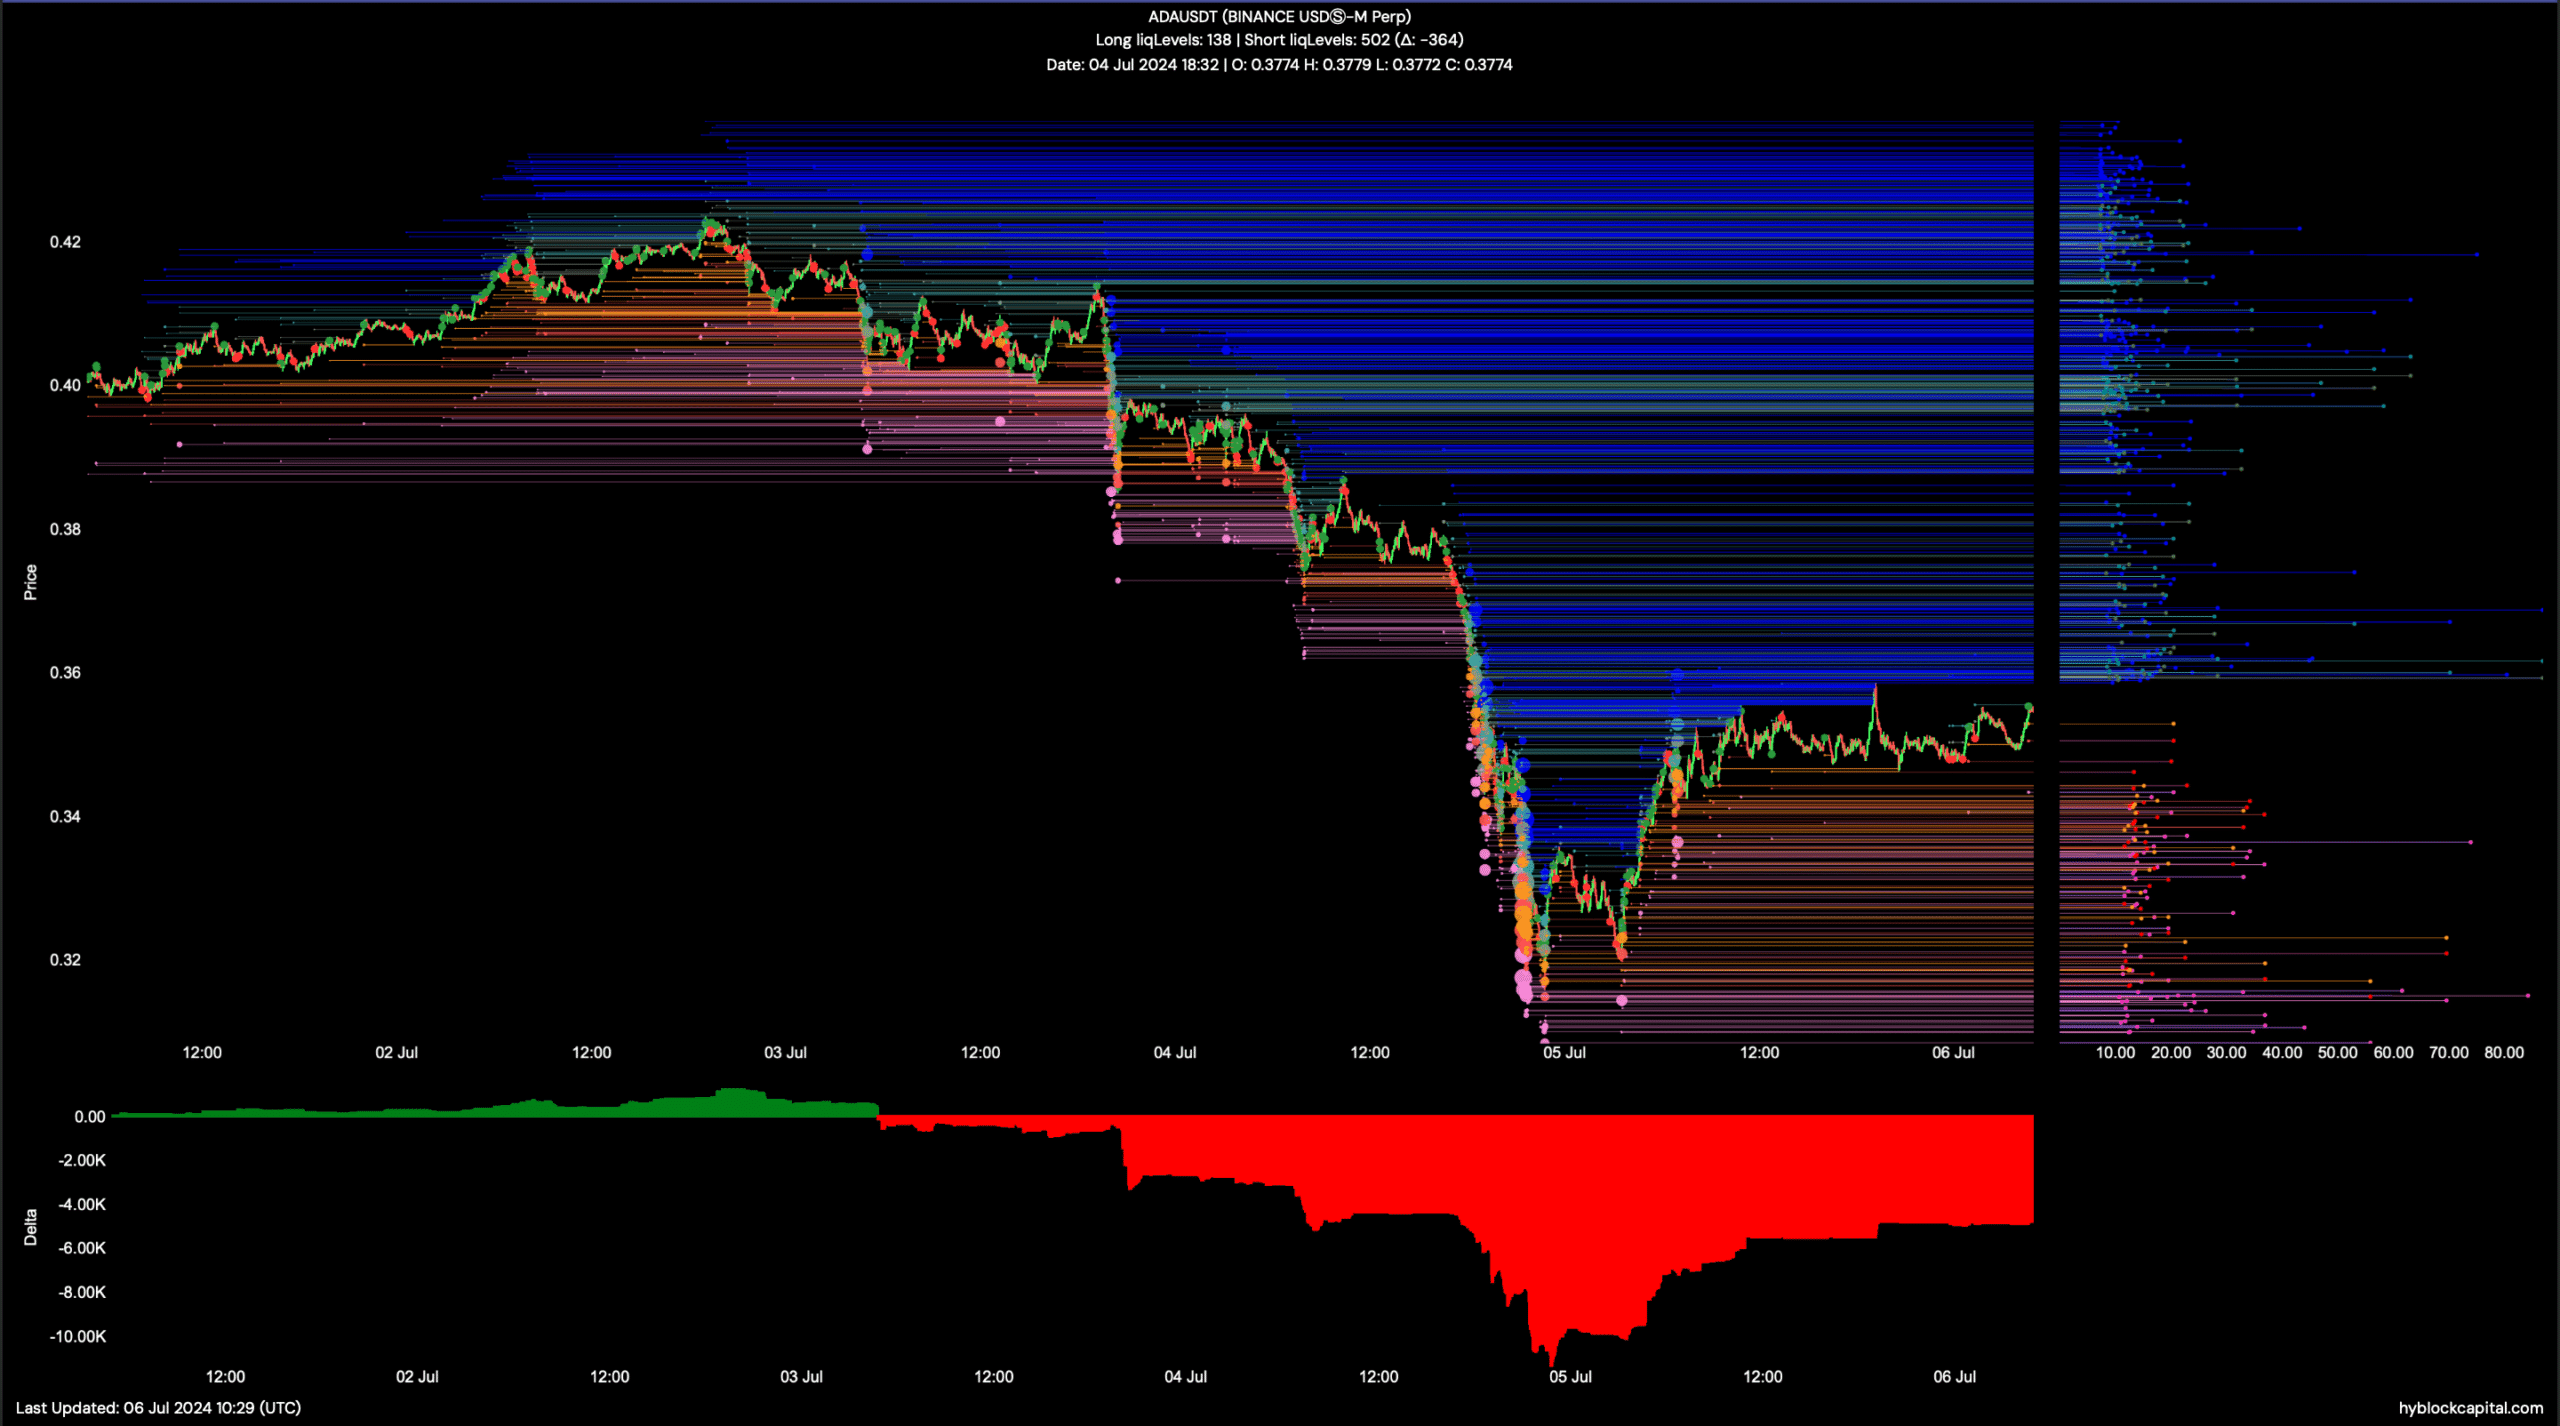
Source: Hyblock Capital
Similarly, the technical indicator Relative Strength Index (RSI) appeared bullish as it registered a rise after reaching the oversold zone.
Is your portfolio green? look at the Cardano profit calculator
Nevertheless, the remaining indicators were bearish. For example, the MACD showed a bearish crossover.
Finally, the Chaikin Money Flow (CMF) fell and also remained below the neutral line. This could keep the price of ADA from rising in the coming days and perhaps weeks.
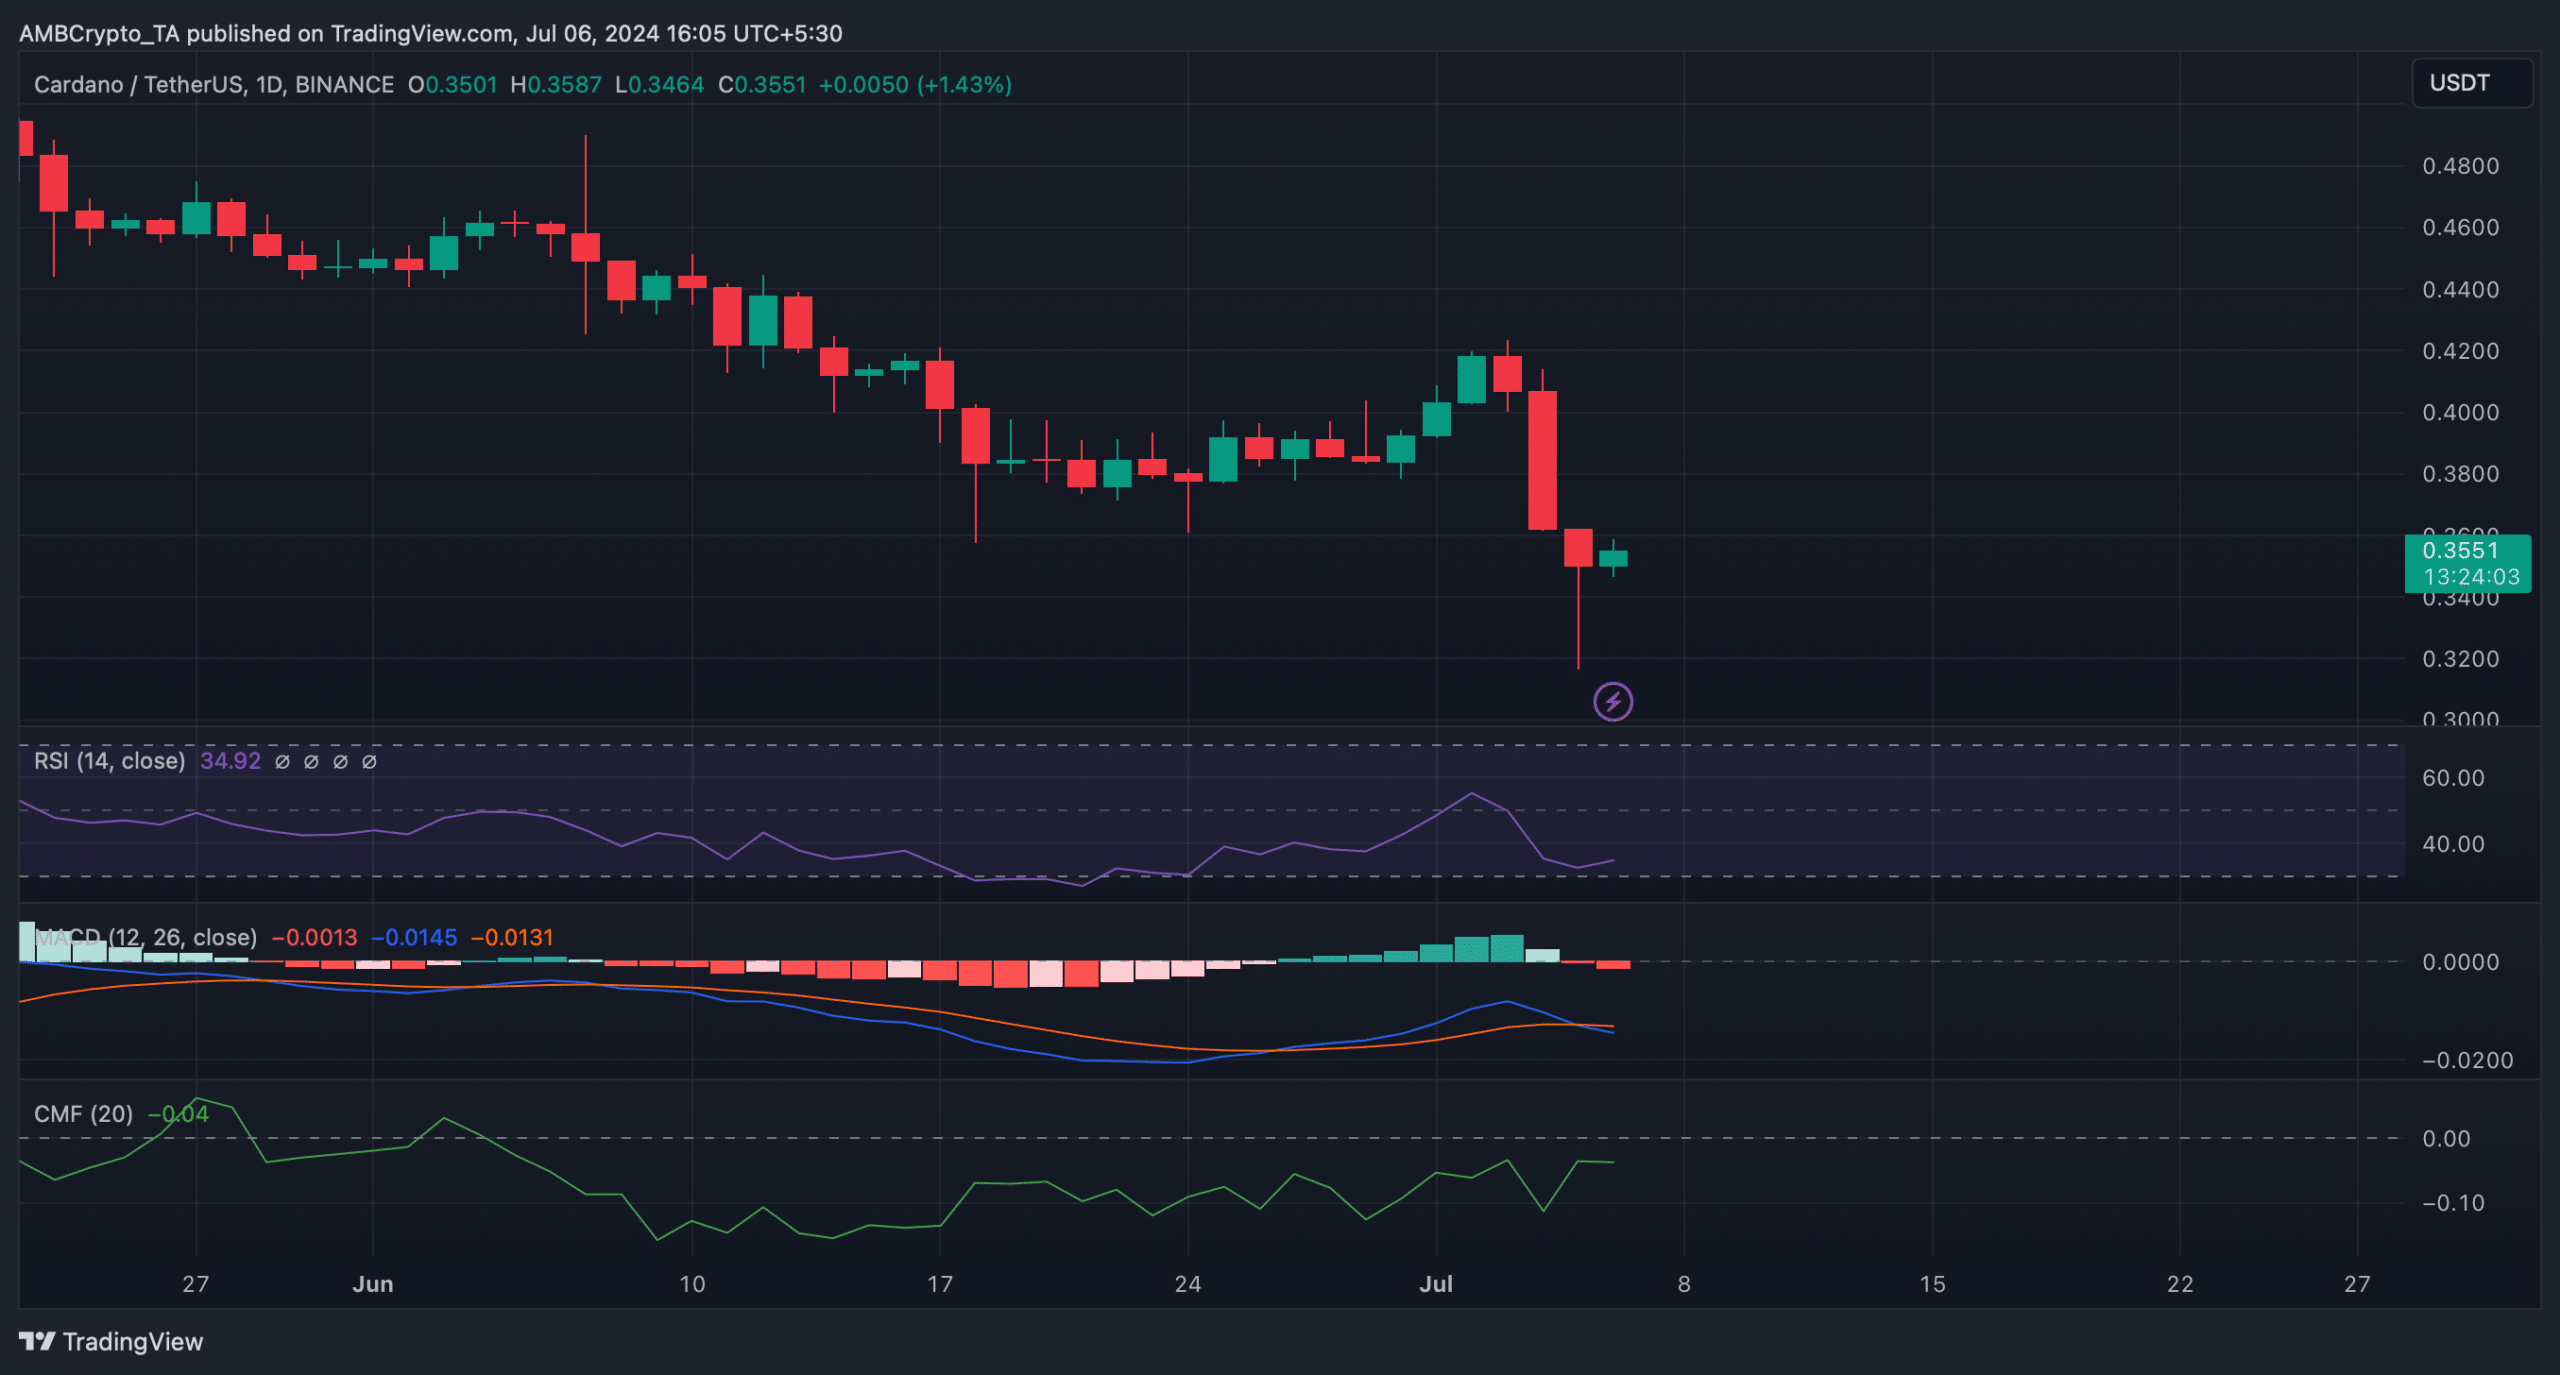
Source: TradingView