

Cardano’s native token, ADA, has been significantly impacted by the recent downturn in the cryptocurrency market, with a notable drop in price. Despite a recent increase of more than 6% in the past 24 hours, bearish sentiment continues to exert its influence.
Over the past week, Cardano has suffered a loss of about 26% in value, leading to it breaking through crucial support levels that have now turned into resistance levels.
From a technical point of view, Cardano points to a prevailing bearish trend, with both demand and accumulation levels remaining relatively low. It becomes crucial for the coin to overcome the overhead resistance to reduce the growing strength of bearish forces and facilitate a possible recovery.
Currently, the coin is oversold leading to the emergence of buyers looking to break through the resistance barriers. In addition, the fall in Bitcoin’s value in recent days, as it once again reached the $26,000 level, has negatively impacted several altcoins, including Cardano. As a result, Cardano’s market capitalization has declined, indicating diminished purchasing power in the market.
Cardano Price Analysis: One Day Chart
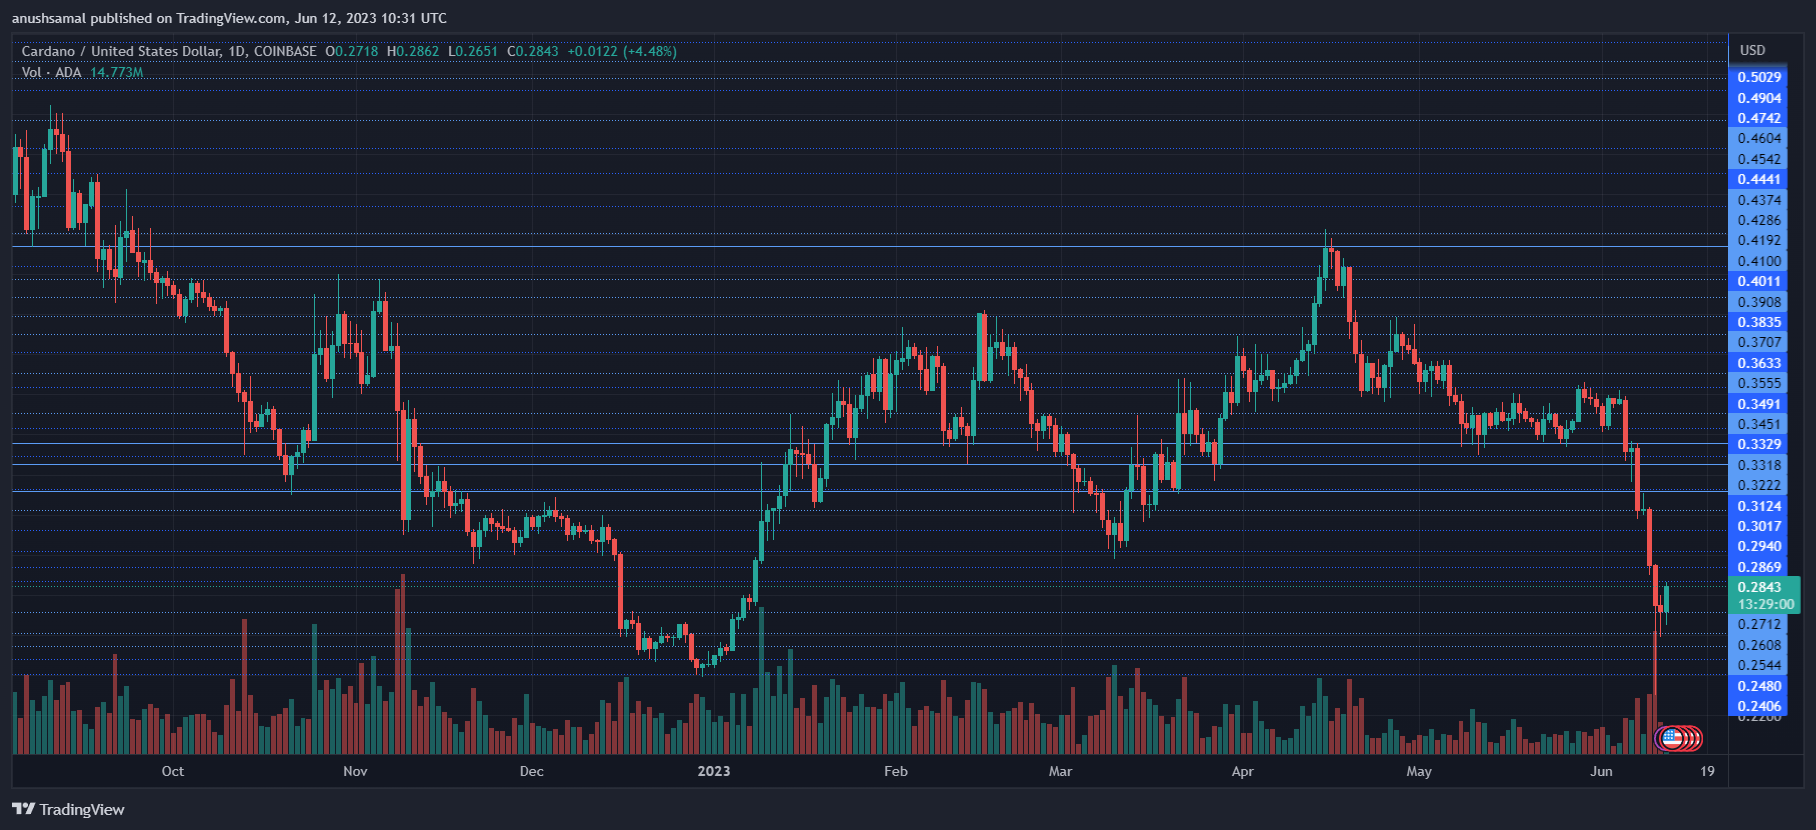
ADA was trading at $0.28 at the time of writing. After the rejection at the $0.34 level, the bears have taken control of the price trajectory. Currently, ADA has revisited a multi-month low price point. This signaled a bearish trend and the crucial resistance level for the altcoin is observed at $0.30.
Should ADA be rejected at this level, there is a possibility that the price will fall further below the current level. In the event of further depreciation, the coin may initially find support at $0.25 and possibly even lower.
Trading volume for Cardano in the last session was relatively low, suggesting that sellers currently have an advantage in the market.
Technical analysis
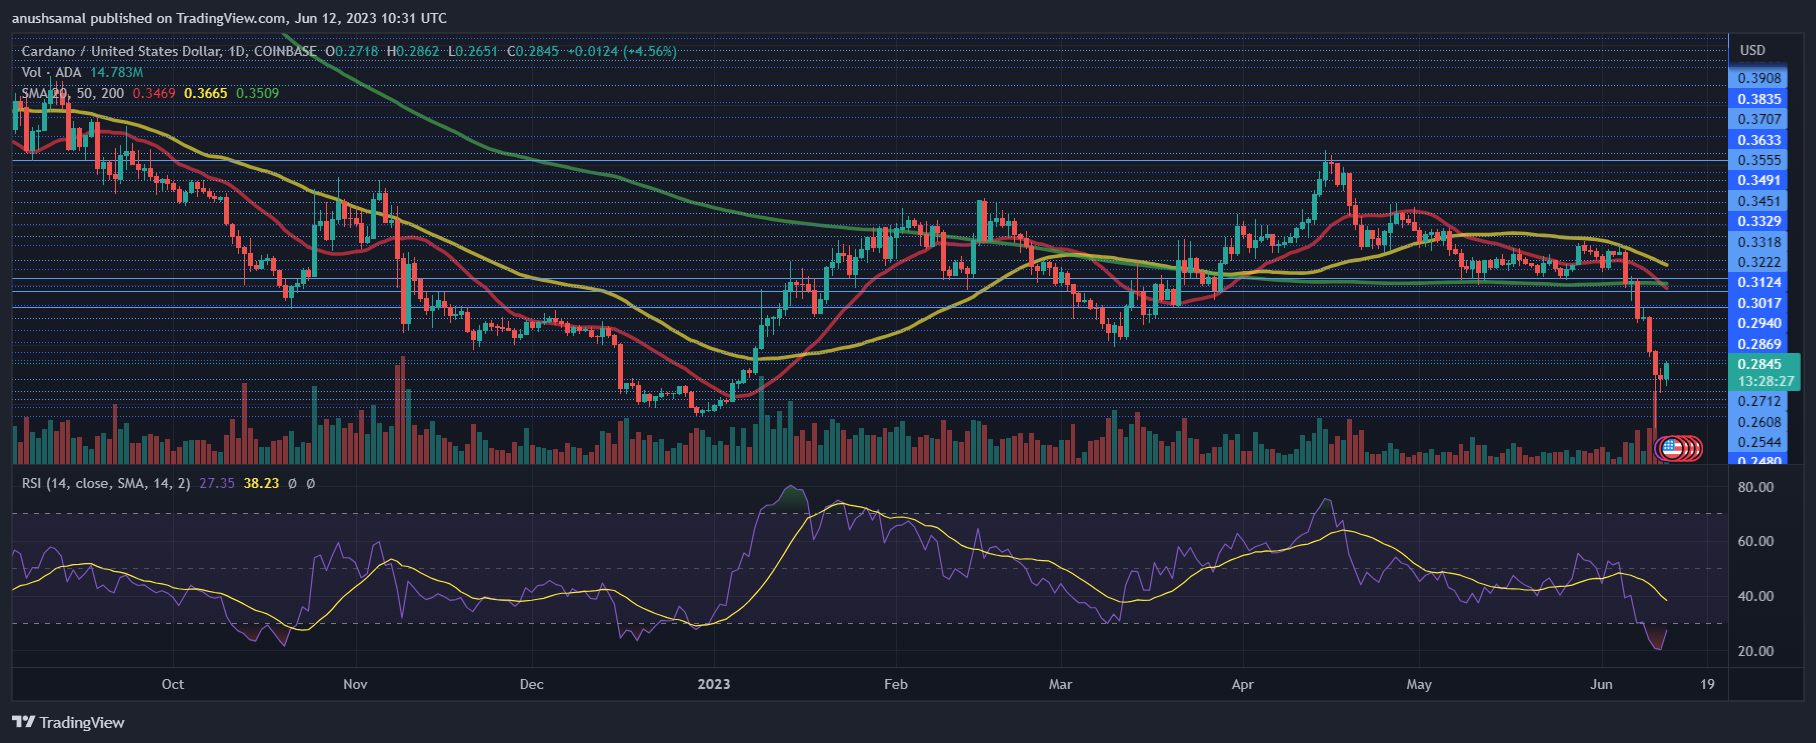
After the $0.34 rejection, Cardano (ADA) is struggling to regain positive momentum and pick up demand. The Relative Strength Index (RSI) has dropped below the half line and even further below 30, indicating that the coin is significantly undervalued and oversold.
In addition, the price of ADA has fallen below the 20-Simple Moving Average (SMA) line, suggesting selling pressure is currently driving price momentum.
To revive demand in the market, ADA must overcome the $0.30 resistance level. Breaking this crucial barrier has the potential to trigger a recovery and lure buyers back to the market.
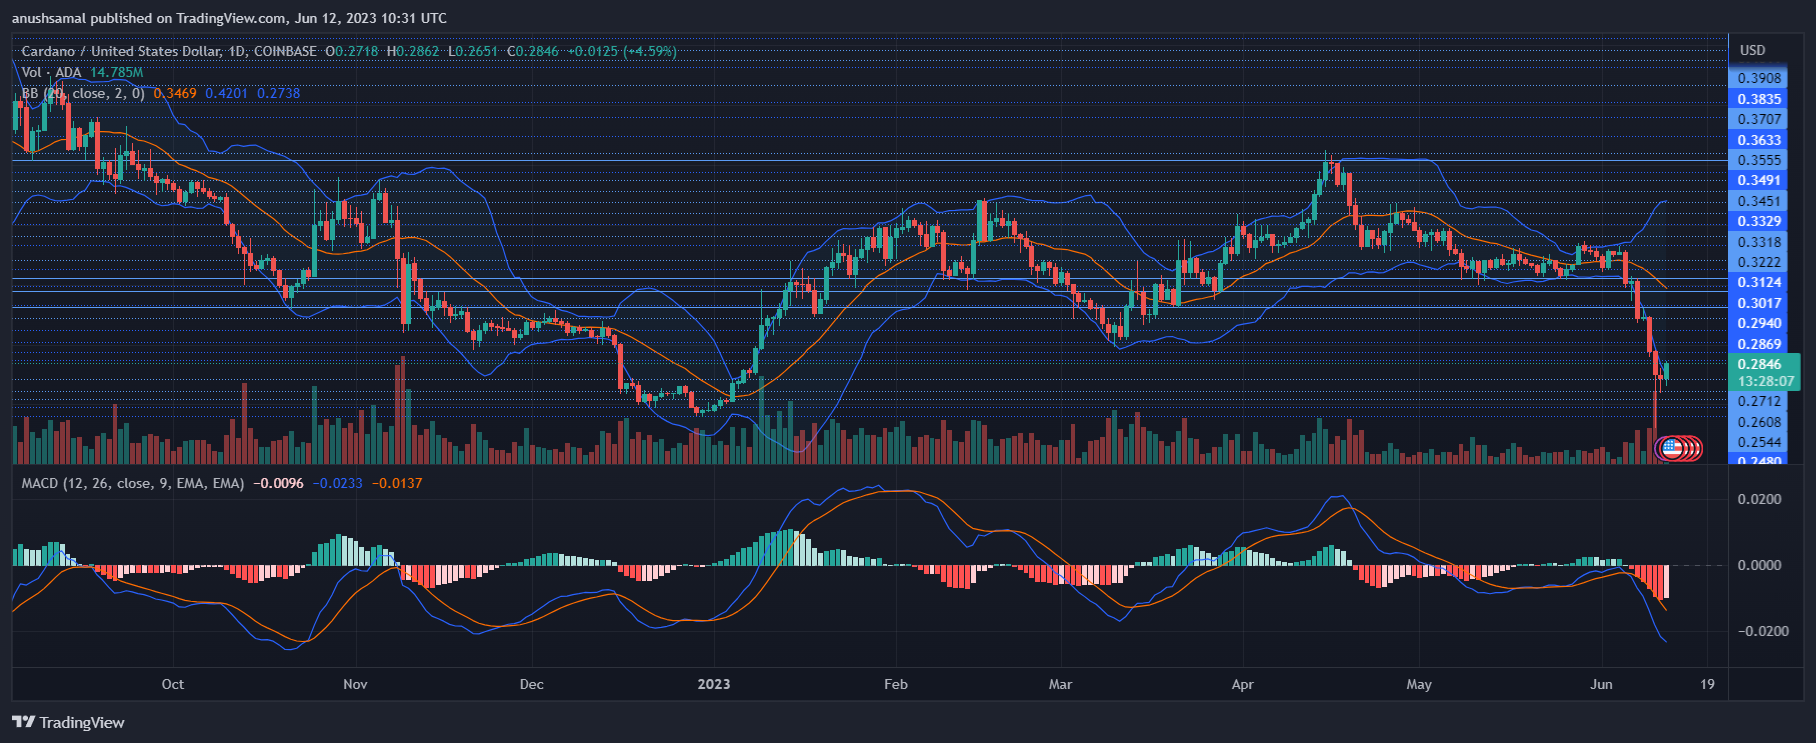
Due to the low demand for ADA, sell signals have emerged pointing to a possible continuation of the downtrend. The Moving Average Convergence Divergence (MACD), which indicates price momentum and possible reversals, has formed red signal bars that align with sell signals for ADA.
In addition, the Bollinger Bands, which reflect price volatility and swings, have diverged significantly. This indicates that there may be increased price volatility and fluctuation in the coming trading sessions.
Featured image from UnSplash, charts from TradingView.com