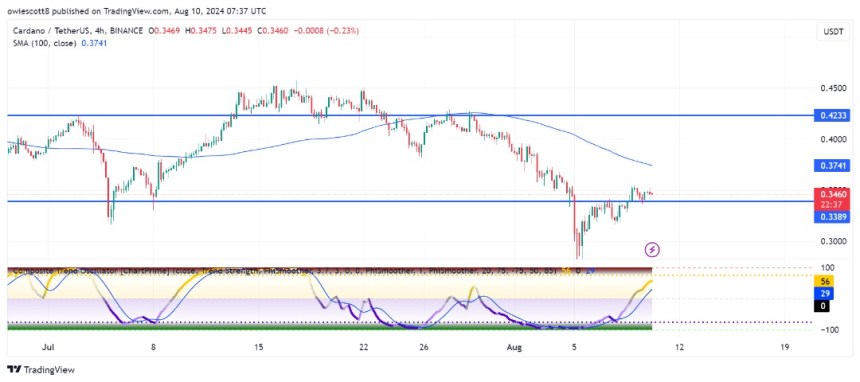
Cardano (ADA) is approaching a critical juncture as it eyes a retest of the key support level at $0.3389. During recent trading sessions, ADA’s price has previously risen above this level and is currently falling for a second retest, raising concerns among investors and traders.
A successful defense of the $0.3389 support could signal a potential reversal and renewed bullish momentum, while a break below this level could open the door to further declines. This article aims to analyze the meaning of the $0.3389 support level for Cardano and whether bullish momentum can keep ADA above this important threshold by examining technical indicators and market sentiment.
With a market capitalization of over $12 billion and a trading volume of over $240 million, ADA’s share price fell 0.69% to approximately $0.3462 at the time of writing. Over the past 24 hours, the market capitalization has fallen by 0.68%, while trading volume has fallen by 26.44%.
Current technical indicators: what they reveal about Cardano
On the 4-hour chart, Cardano is trading below the 100-day Simple Moving Average (SMA) and is currently experiencing a bearish trend towards $0.3389. Given this bearish sentiment, it is likely that the bears can continue to exert control and push the price to this critical level.

A 4-hour Composite Trend Oscillator analysis shows that both the signal line and the SMA line of the indicator have successfully climbed above the zero line and are now approaching the overbought zone. This suggests that the current decline could be temporary and the bulls may regain control at $0.3389.
On the 1-day chart, Cardano is still trading below the 100-day SMA and trying to make a bearish move towards $0.3389, meaning the bears are currently in control and could potentially push the price down.

Finally, on the 1-day chart, both the signal line and the SMA line of the composite trend oscillator have fallen below the zero line and entered the oversold zone. This indicates that the price of ADA could reverse upon reaching the $0.3389 mark.
Analysis: Potential outcomes if the $0.3389 support holds or fails
An analysis of possible outcomes indicates that if Cardano’s price reaches the support level at $0.3389 and this key level holds, it could start to rise towards the resistance level at $0.4233. If the price successfully breaks this resistance, it may continue to test higher levels.
However, if the $0.3389 mark does not hold and the price falls below this level, the digital asset could fall further towards $0.2388. If this level is breached, the crypto asset may experience more price declines towards other support points below.

