
 Falls: Ethereum’s Fall Pulls Altcoins Down")
Cardano price started a new decline below the USD 0.4120 support. Ethereum’s decline appears to be dragging the ADA towards the $0.380 support.
- ADA price started a fresh decline from the $0.450 resistance zone.
- The price is trading below $0.4120 and the 100-hour simple moving average.
- A major bearish trendline is forming with resistance at $0.4060 on the hourly chart of the ADA/USD pair (Kraken data source).
- The pair could continue to decline and test the $0.380 support zone.
Cardano Price shows signs of more downsides
After a steady rise, Cardano faced sellers near the $0.450 resistance zone. ADA formed a short-term top and started a pullback below the USD 0.4250 level. Recently, Ethereum’s decline dragged it further below the $0.400 support.
A low is formed near USD 0.3919 and the price is consolidating losses from a bearish angle. There is also a major bearish trendline forming with resistance at $0.4060 on the hourly chart of the ADA/USD pair.
Cardano price is now trading below $0.4100 and the 100-hourly moving average. If a recovery wave comes, the price may face resistance near the $0.4050 zone and the 50% Fib retracement level of the downward move from the $0.4211 swing high to the $0.3919 low.
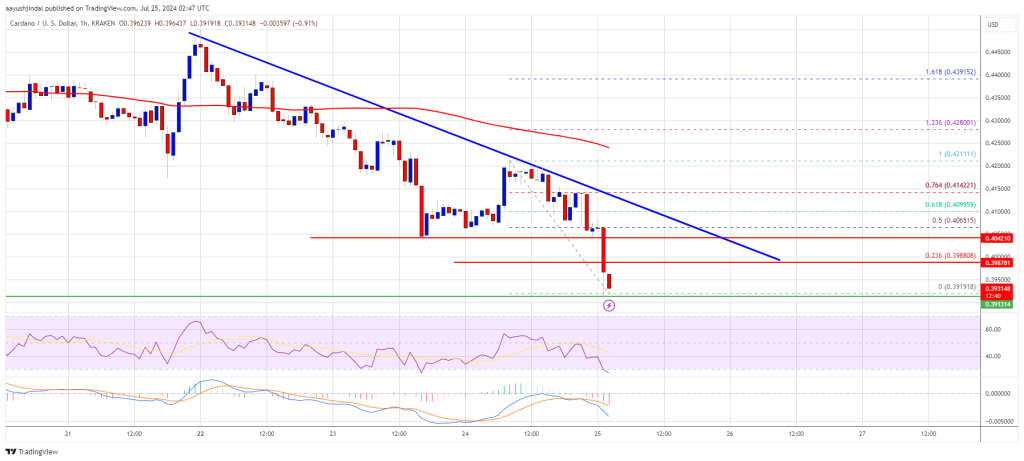
First resistance is near $0.4150 or the 76.4% Fib retracement level of the downward move from the $0.4211 swing high to the $0.3919 low. The next major resistance could be $0.4220. If there is a close above the resistance at $0.4220, the price could start a strong rally. In the mentioned case, the price could rise towards the $0.4450 region. Further gains could require a move to $0.4500.
More disadvantages in ADA?
If Cardano price fails to rise above the USD 0.4050 resistance level, it could continue to decline. The immediate downside support is near the $0.3920 level.
The next major support is near the $0.3800 level. A downside break below the USD 0.3800 level could open the doors for a test of USD 0.3650. The next major support is near the $0.3500 level, where the bulls could emerge.
Technical indicators
Hourly MACD – The MACD for ADA/USD is gaining momentum in the bearish zone.
Hourly RSI (Relative Strength Index) – The RSI for ADA/USD is now below the 50 level.
Major support levels – USD 0.3920 and USD 0.3800.
Major resistance levels – $0.4050 and $0.4150.