

The XRP price is slowly moving up from the $0.5080 zone. It could gain bullish momentum if a move above the USD 0.5250 resistance zone takes place.
- XRP attempts a fresh rise above the $0.5120 zone.
- The price is now trading above USD 0.5150 and the 100-hourly Simple Moving Average.
- There was a break above a key bearish trendline with resistance near $0.5160 on the hourly chart of the XRP/USD pair (Kraken data source).
- The pair could start a decent climb if there is a clear move above $0.5250.
XRP Price Eyes Recovery
XRP price extended losses below the $0.5120 level, like Bitcoin and Ethereum. The price tested the $0.5080 zone and recently started a decent recovery wave.
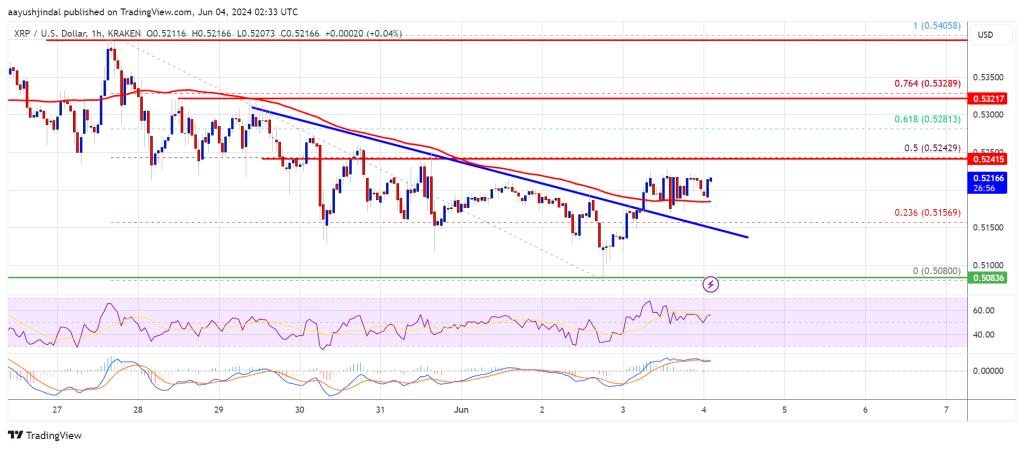
The price was able to break the USD 0.5120 and USD 0.5150 resistance levels. There was a break above a key bearish trendline with resistance near $0.5160 on the hourly chart of the XRP/USD pair. The pair crossed the 23.6% Fib retracement level of the downward move from the $0.5400 swing high to the $0.5080 low.
The price is now trading above USD 0.5150 and the 100-hourly Simple Moving Average. On the upside, the price is facing resistance around the $0.5220 level.
The first major resistance is near $0.5250 or the 50% Fib retracement level of the downward move from the $0.5400 swing high to the $0.5080 low. A close above the USD 0.5250 resistance zone could send the price higher. The next major resistance is near $0.5320.
If there is a close above the resistance level at $0.5320, there could be a steady rise towards the resistance at $0.5450. Any further gains could send the price towards the USD 0.5650 resistance.
Another drop?
If XRP fails to break the USD 0.5250 resistance zone, it could trigger another decline. The initial downside support is near the $0.5160 level.
The next major support is at $0.5080. If there is a downside break and a close below the USD 0.5080 level, the price may accelerate lower. In the said case, the price could fall and retest the $0.50 support in the short term.
Technical indicators
Hourly MACD – The MACD for XRP/USD is now gaining speed in the bullish zone.
Hourly RSI (Relative Strength Index) – The RSI for XRP/USD is now above the 50 level.
Major support levels – $0.5160 and $0.5080.
Major resistance levels – $0.5220 and $0.5250.