

- Solana’s price continues to hit lower lows despite increased trading volume.
- There could be a correction on the horizon for SOL, with recent bullish momentum needing to continue for the trend to change.
Solana [SOL] recently faced intense bearish pressure, which has pushed the price to lower lows despite bulls’ attempts to maintain momentum.
The increased trading volume signals increased market activity, but overall sentiment remains cautious as traders await signs of a possible turnaround.
Solana bulls remain cautious
Over the past five days, SOL has seen multiple annotations of an Inverse Head and Shoulders (IH&S) pattern, which is typically a bullish reversal pattern.
However, the success of this reversal pattern depends on a strong breakout above the neckline (the resistance line formed at the top of the head).
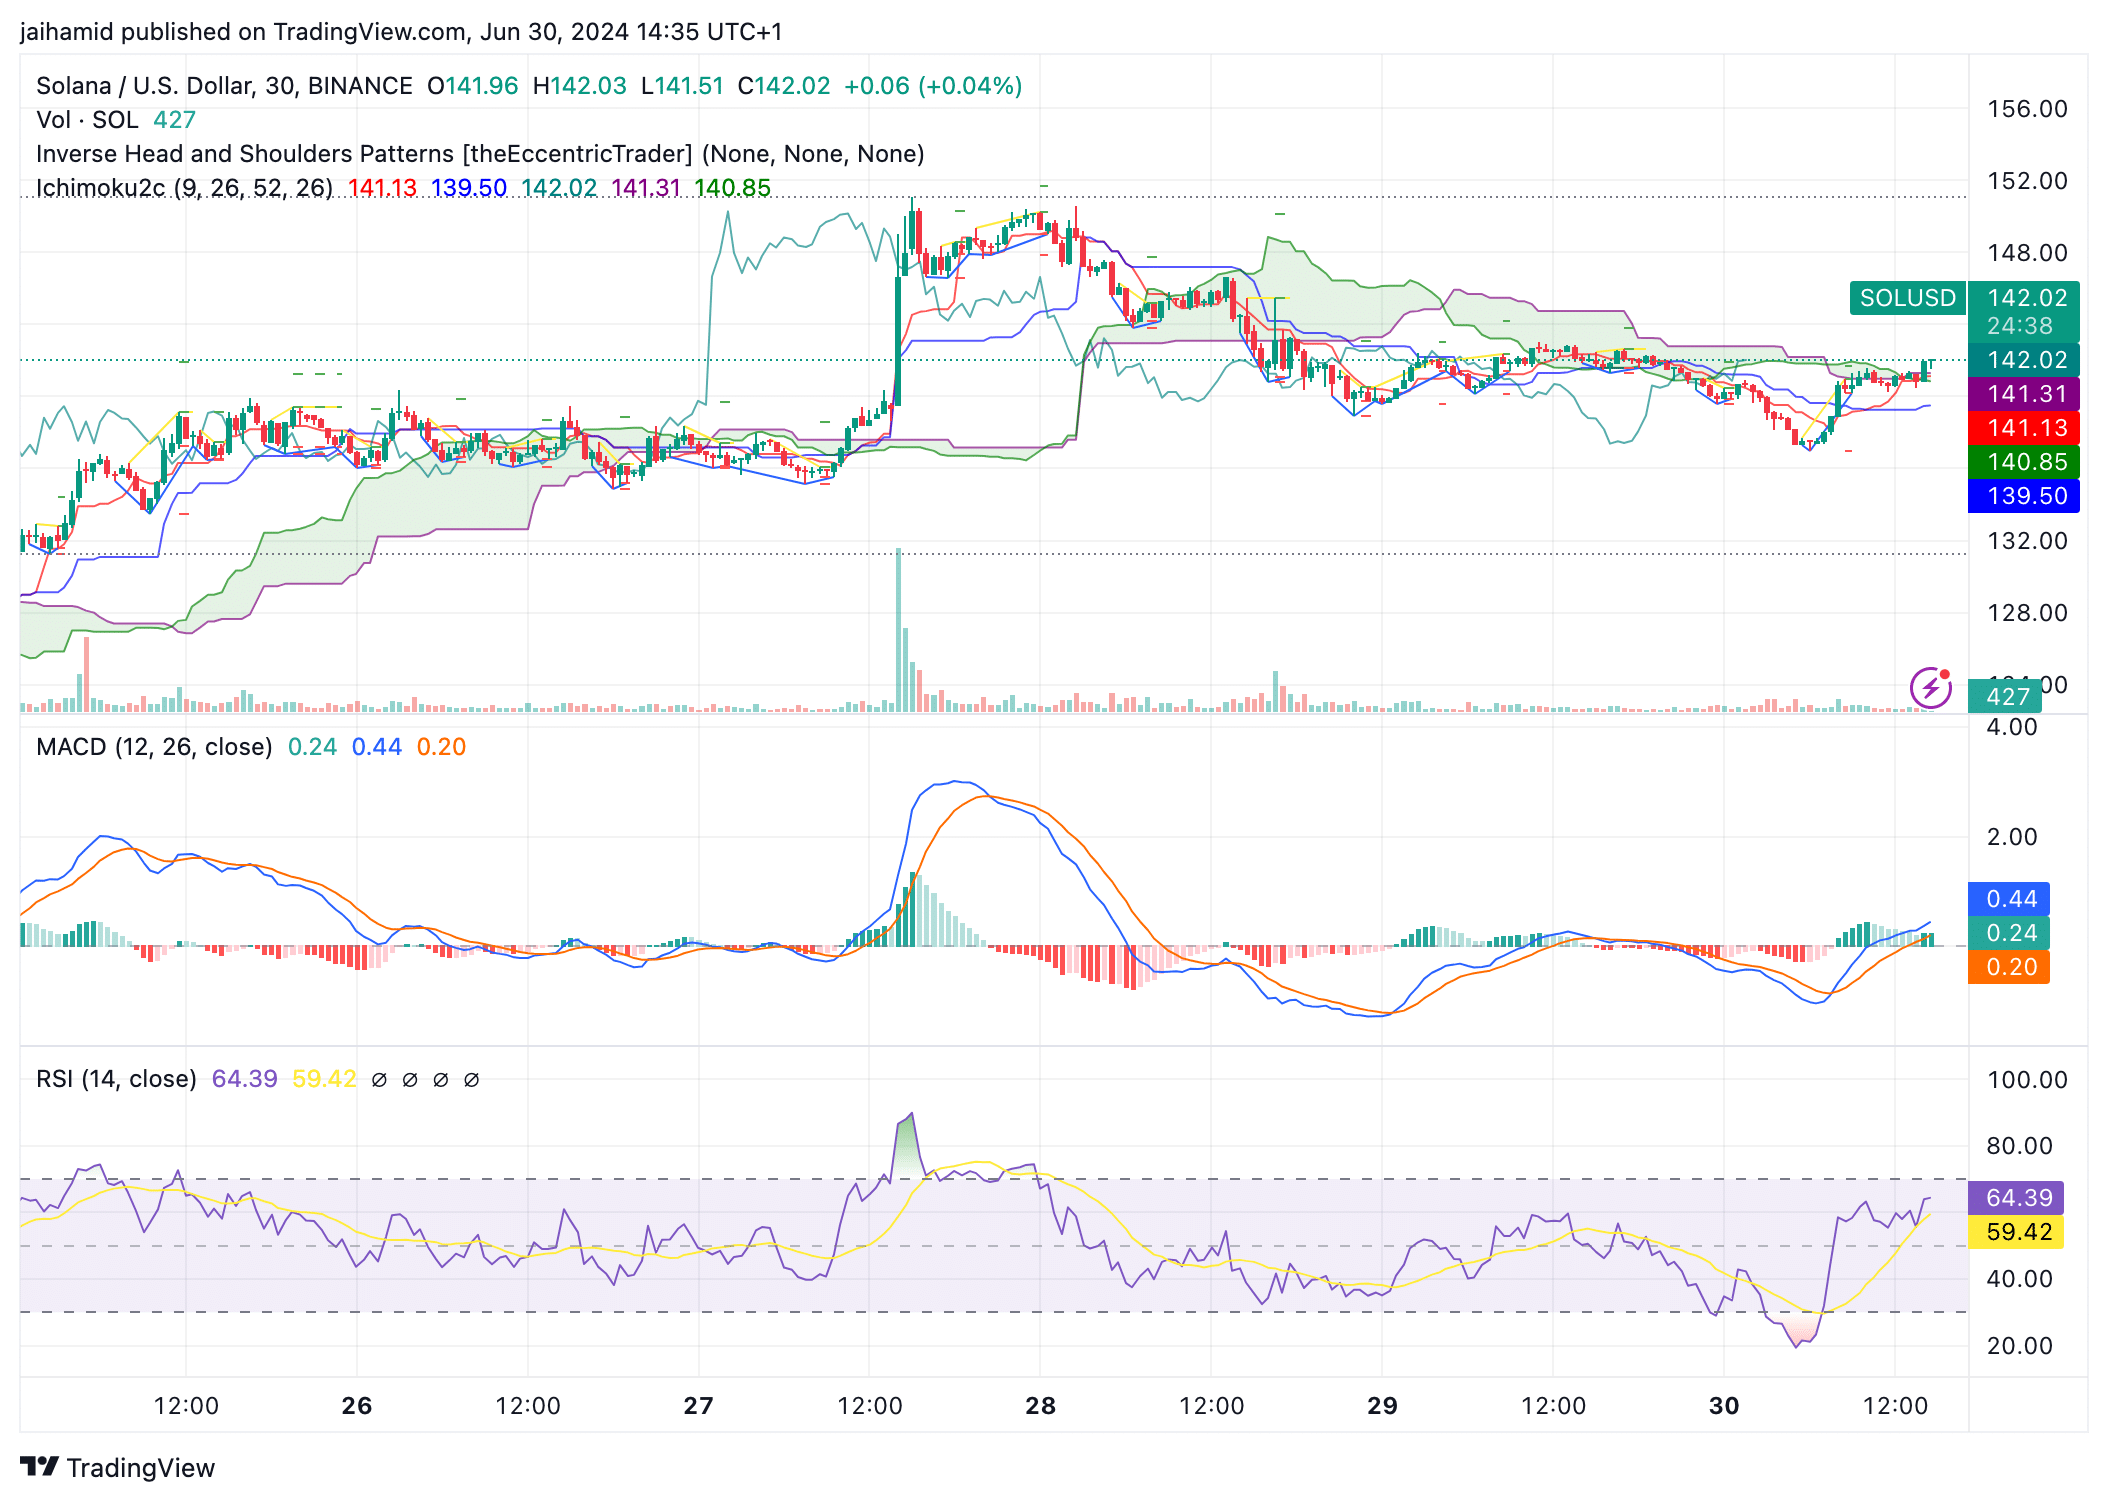
Source: TradingView
As for the Ichimoku Cloud, the price of SOL is currently trading within the cloud, which generally indicates a zone of indecision or potential trend change.
The cloud acts as a support/resistance area, with its color changing from red to green, indicating a shift toward bullish conditions in the short term.
The Tenkan-sen and Kijun-sen lines are relatively close to each other below the price, indicating that the short-term momentum is somewhat bullish, but still not strong conviction.
The MACD histogram, which measures the distance between these two lines, has gone from negative to positive values, indicating an increase in bullish momentum, albeit cautiously.
The RSI at the time of writing was around 59, which is neither overbought nor oversold. The recent RSI spike just below the overbought threshold (70) and subsequent downturn reflect the increase in selling pressure following bulls’ attempts to push the price higher, echoing cautious sentiment.
Is SOL heading for a correction?
As the bulls try in vain to turn the story around, another story takes shape. The Stochastic Oscillator tells us that a correction may be underway.
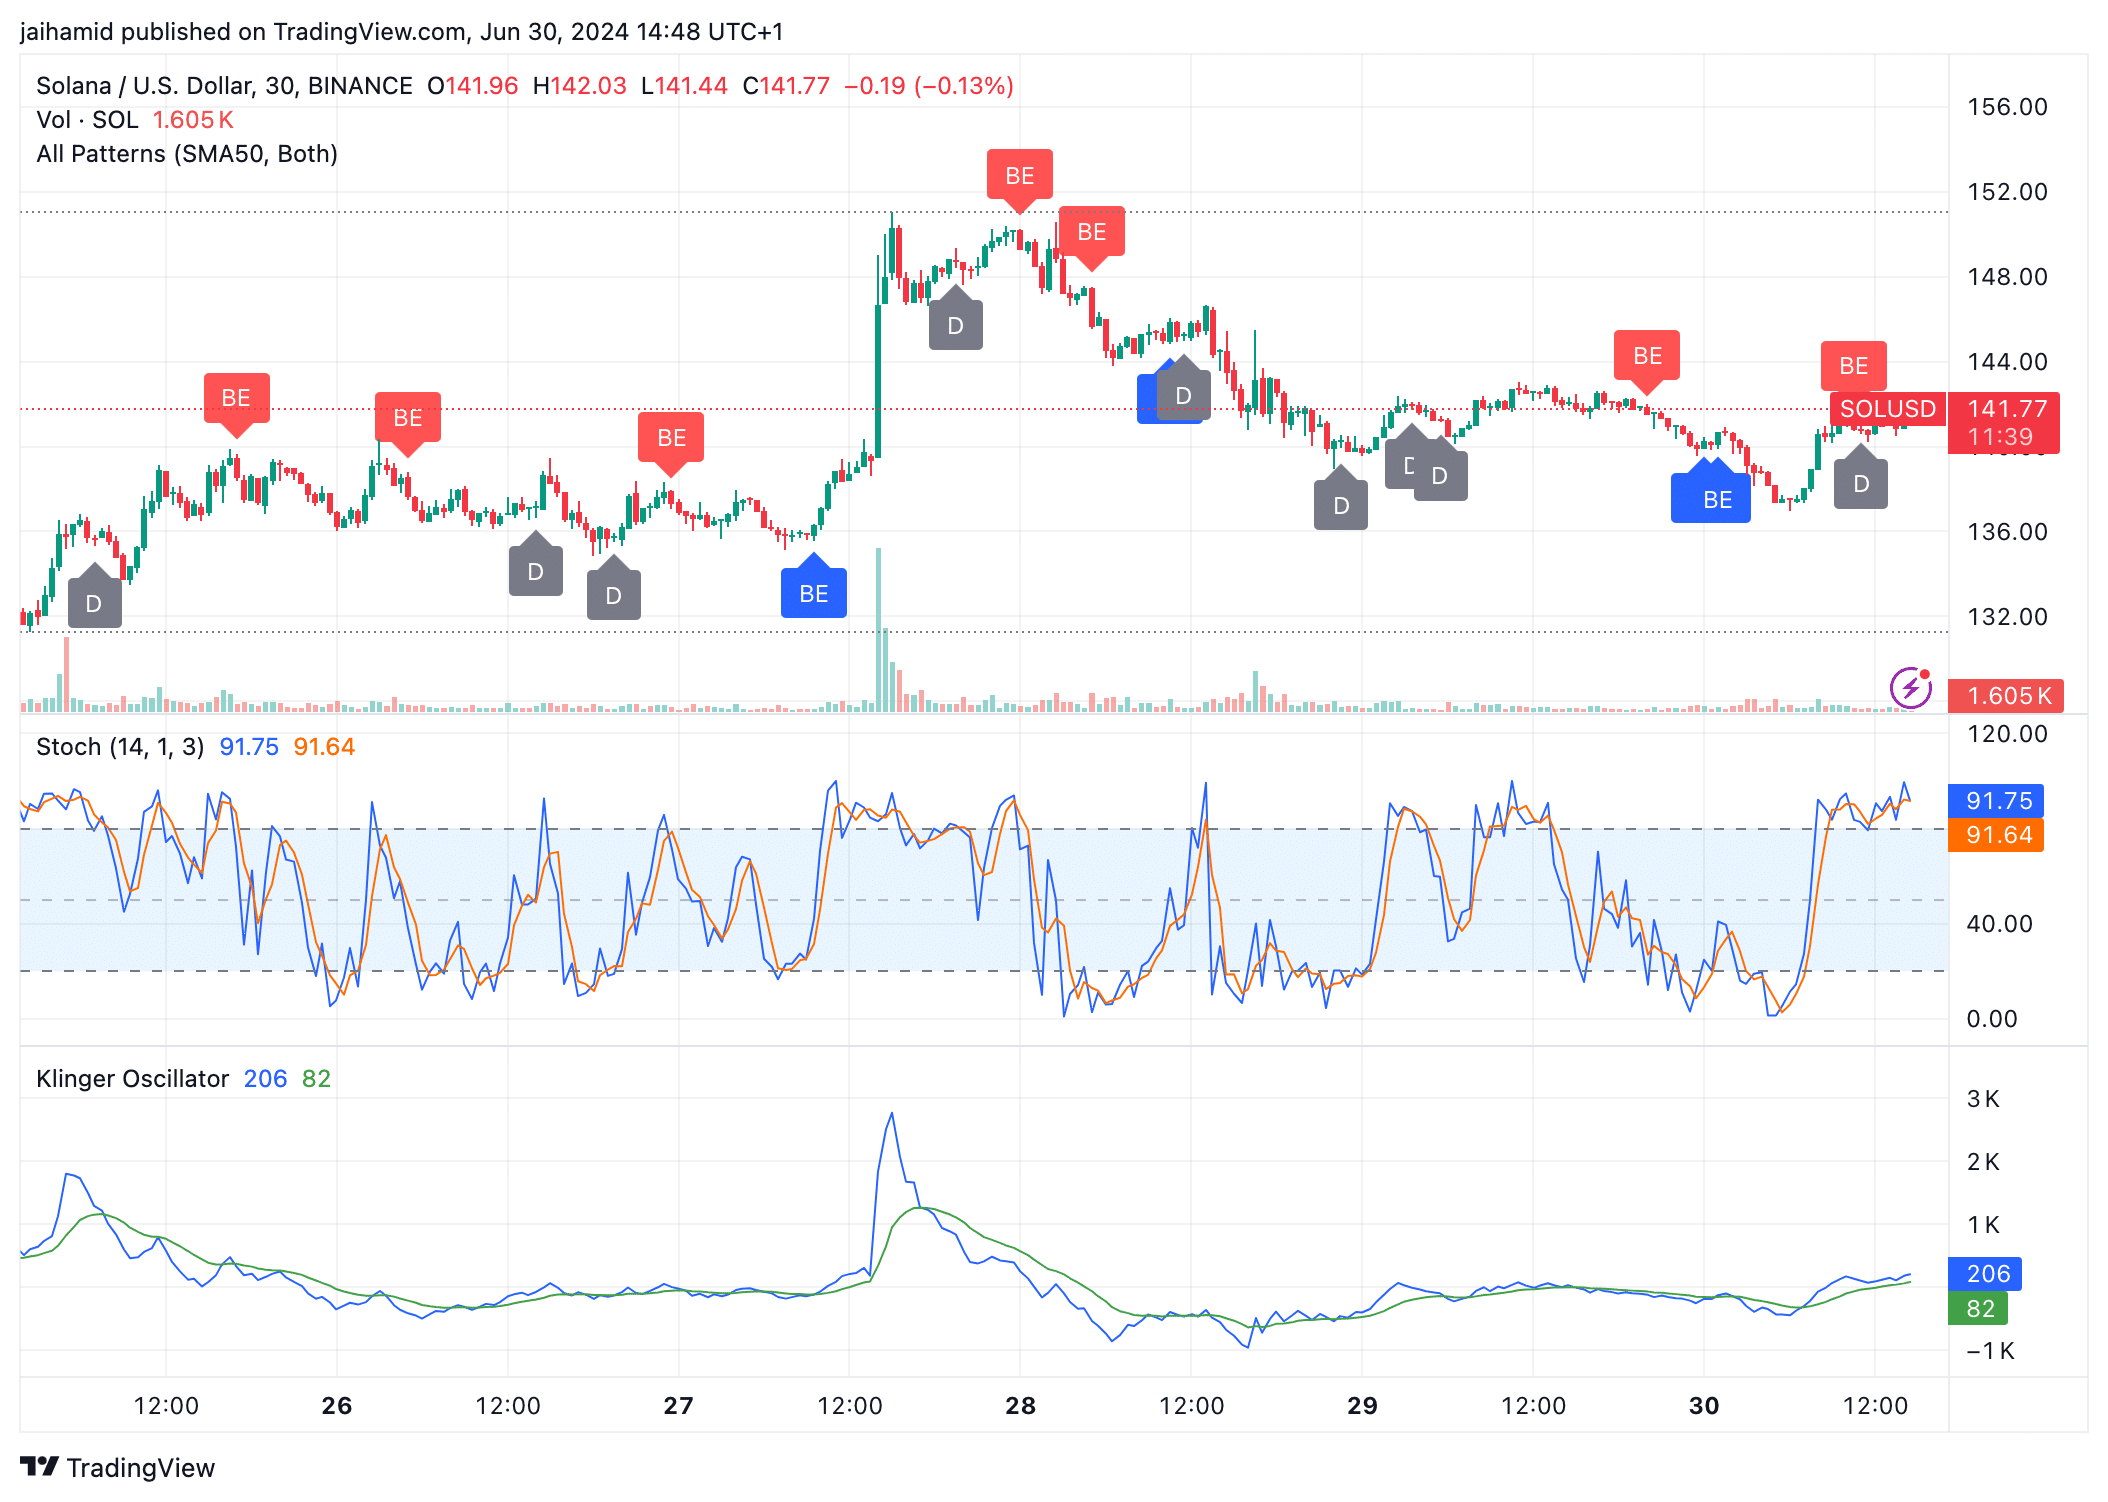
Source: TradingView
Solana may be due for a correction as the price may be perceived as relatively high compared to its recent trading range.
Is your portfolio green? View the SOL Profit Calculator
The Klinger Oscillator shows a cross where the faster line (green) moves above the slower line (blue), indicating potential short-term bullish momentum.
If this continues, it is a positive sign for bulls.