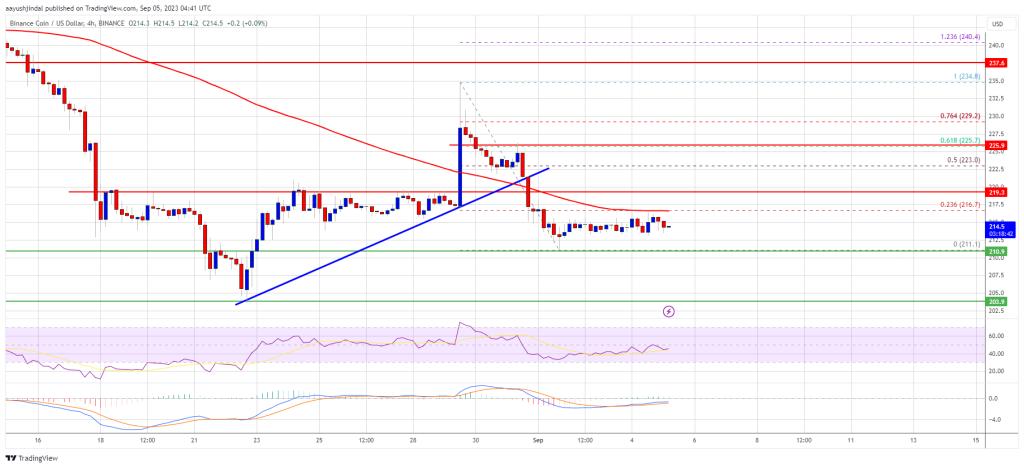
The BNB (Binance coin) price failed to rise above $225 and reduced gains against the US dollar. The price could drop sharply if it trades below USD 210.
- Binance coin price tested the USD 235 resistance before the bears appeared against the US dollar.
- The price is now trading below USD 220 and the 100 simple moving average (4 hours).
- There was a break below a key bullish trendline with support near USD 220 on the 4-hour chart of the BNB/USD pair (data source from Binance).
- The pair could continue to fall unless there is a close above $225.
Binance Coin Price Fails Again
In the last analysis, we discussed the chances of BNB price recovering towards the USD 235 resistance zone. The price did climb higher towards the USD 235 resistance, but failed to extend gains.
It started a fresh decline from the $235 zone. There was a break below a key bullish trendline with support near $220 on the 4-hour chart of the BNB/USD pair. The pair is now showing bearish signs below USD 220 and the 100 simple moving average (4 hours), just like Bitcoin and Ethereum.
A low is forming near USD 211.1 and the price is now consolidating losses. On the upside, it is facing resistance near the USD 216.5 level and the 100 simple moving average (4 hours). It is close to the 23.6% Fib retracement level of the recent drop from the $235 swing high to the $211 low.

Source: BNBUSD at TradingView.com
A clear move above the $217 zone could see the price rise further. The next major resistance is near USD 225 or the 61.8% Fib retracement level from the recent drop from the USD 235 swing high to the USD 211 low, above which the price could rise towards USD 235. A close above the USD 235 resistance could set the pace for a larger increase towards the USD 250 resistance.
Another decline in the BNB?
If BNB fails to clear the USD 217 resistance, it could spark another decline. The initial downside support is near the USD 211 level.
The next major support is near the USD 210 level. If there is a downside break below the USD 210 support, the price could decline towards the USD 202 support. More losses could push the price towards the USD 184 support.
Technical indicators
4-hour MACD – The MACD for BNB/USD is losing pace in the bearish zone.
4-hour RSI (Relative Strength Index) – The RSI for BNB/USD is currently below the 50 level.
Key Support Levels – $211, $210 and $202.
Key resistance levels – $217, $225 and $235.

