

BNB price is gaining bullish momentum from the $315 support zone. The price could extend its rally above USD 375 and rise towards the USD 400 level in the near term.
- BNB price is showing bullish signs above the $350 pivot level.
- The price is now trading above USD 355 and the 100 simple moving average (4 hours).
- A major bullish trendline is forming with support at $354 on the 4-hour chart of the BNB/USD pair (Binance data source).
- The pair could gain bullish momentum if a close above the $365 resistance zone.
BNB price regains strength
In recent days, BNB price started a significant increase and managed to break the USD 335 resistance zone. There was a move above the $350 level to move into a positive zone like Bitcoin and Ethereum.
The price even peaked above $365. A high was formed near $366 and the price is now consolidating gains above the 23.6% Fib retracement level of the upward move from the $315 swing low to the $366 high. BNB is now trading above $355 and the 100 simple moving average (4 hours).
There is also a major bullish trendline forming with support at $354 on the 4-hour chart of the BNB/USD pair. The immediate resistance is near the $365 level.
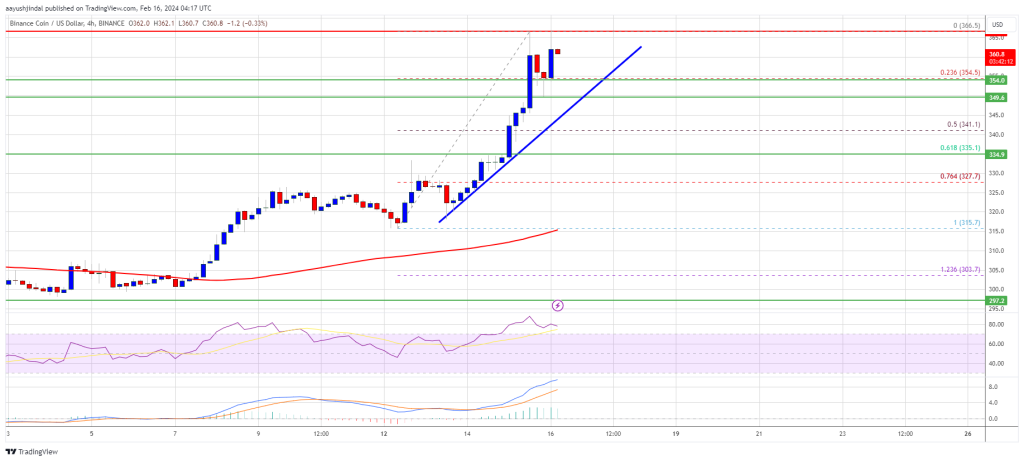
Source: BNBUSD on TradingView.com
The next resistance is near the $375 level. A clear move above the $375 zone could send the price rising further. In the said case, BNB price could test $388. A close above the USD 388 resistance could set the pace for a bigger rise towards the USD 400 resistance. Further gains could require a test of the $420 level.
Dips supported?
If BNB fails to clear the USD 365 resistance, it could initiate a downward correction. The initial downside support is near the $355 level and the trendline.
The next major support is near the $342 level or the 50% Fib retracement level of the upward move from the $315 swing low to the $366 high. The main support is at USD 335. If there is a downside break below the USD 335 support, the price could fall towards the USD 322 support. Any further losses could trigger a bigger decline towards the $315 level.
Technical indicators
4-hour MACD – The MACD for BNB/USD is gaining speed in the bullish zone.
4-hour RSI (Relative Strength Index) – The RSI for BNB/USD is currently above the 50 level.
Major support levels – $355, $342 and $335.
Major resistance levels – $365, $375 and $388.
Disclaimer: The article is for educational purposes only. It does not represent NewsBTC’s views on buying, selling or holding investments and of course investing involves risks. You are advised to conduct your own research before making any investment decisions. Use the information on this website entirely at your own risk.