

BNB price is consolidating above the USD 700 support zone. The price is consolidating and could aim for a fresh rise above the USD 720 resistance.
- BNB price is struggling to break the USD 720 resistance zone.
- The price is now trading above $700 and the 100-hour moving average.
- A major bullish trendline is forming with support at $708 on the hourly chart of the BNB/USD pair (Binance data source).
- The pair needs to remain above the $700 level to rise again in the near term.
BNB price aims higher
After a downward correction, BNB price found support at $690. It is now recovering losses like Ethereum and Bitcoin. There was a move above the USD 700 level.
The bulls were able to push the price above the USD 712 resistance. However, the bears are active near the $720 zone. A high was reached at $717 and the price is now consolidating gains above the 23.6% Fib retracement level of the upward move from the $689 swing low to the $717 high.
The price is now trading above $700 and the 100-hour moving average. There is also a major bullish trendline forming with support at $708 on the hourly chart of the BNB/USD pair.
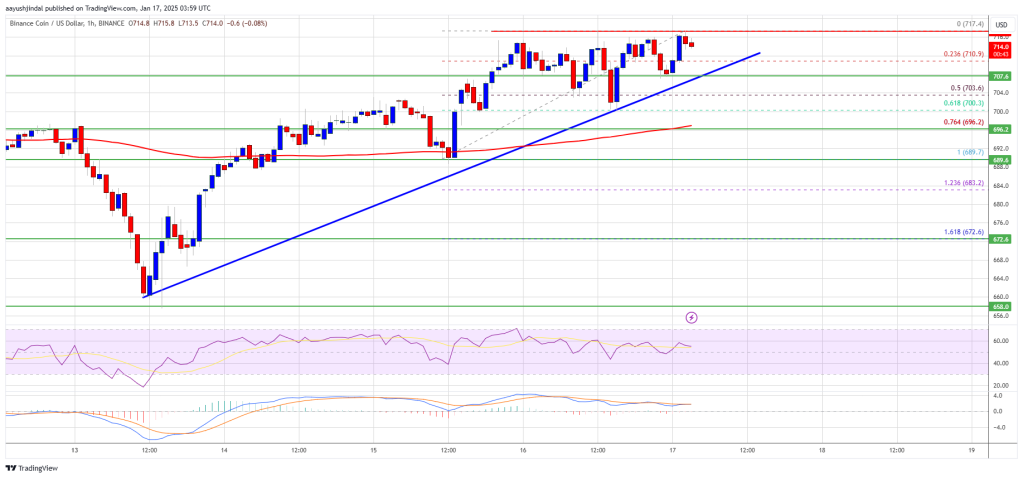
If a new increase occurs, the price may encounter resistance near the $718 level. The next resistance is near the $720 level. A clear move above the $720 zone could send the price higher. In the said case, BNB price could test $732. A close above the USD 732 resistance could set the pace for a bigger move towards the USD 740 resistance. Further gains could require a test of the $750 level in the near term.
Another dive?
If BNB fails to clear the USD 720 resistance, it could trigger a fresh decline. The initial downside support is near the $708 level and the trendline. The next major support is near the $703 level.
The key support is at $700 or the 61.8% Fib retracement level of the upward move from the $689 swing low to the $717 high. If there is a downside break below the USD 700 support, the price could fall towards the USD 692 support. Any further losses could trigger a bigger decline towards the $685 level.
Technical indicators
Hourly MACD – The MACD for BNB/USD is losing pace in the bullish zone.
Hourly RSI (Relative Strength Index) – The RSI for BNB/USD is currently above the 50 level.
Major support levels – USD 708 and USD 700.
Major resistance levels – $720 and $732.