

BNB price is consolidating losses below the USD 1,200 zone. The price is now facing hurdles near USD 1,250 and could fall again in the near term.
- BNB price is correcting gains and trading below the USD 1,200 support zone.
- The price is now trading below $1,180 and the 100-hour moving average.
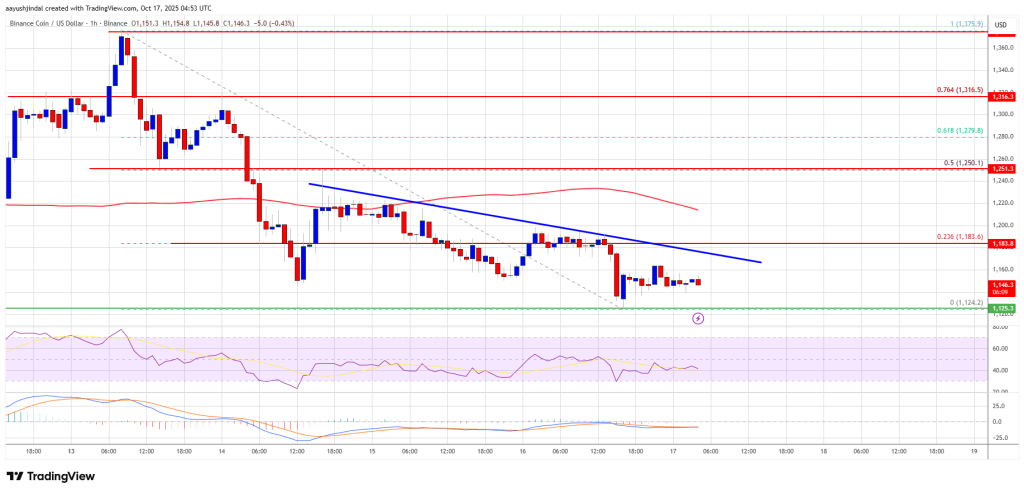
- A short-term bearish trendline is forming with resistance at $1,180 on the hourly chart of the BNB/USD pair (Binance data source).
- The pair needs to remain above the $1,120 level to rise again in the near term.
BNB price drops under support
After a steady increase, BNB price failed to reach the $1,375 zone. There was a downward correction below the $1,300 and $1,250 levels, similar to Ethereum and Bitcoin.
The price even fell below $1,200 and tested $1,125. A low was formed at $1,124, and the price is now consolidating losses below the 23.6% Fib retracement level of the downward move from the $1,375 swing high to the $1,124 low.
The price is now trading below $1,180 and the 100-hour moving average. Moreover, in the short term, a bearish trendline is forming with resistance at $1,180 on the hourly chart of the BNB/USD pair.
On the upside, the price could encounter resistance near the USD 1,180 level. The next resistance is near the $1,200 level. A clear move above the $1,200 zone could send the price higher. In the said case, BNB price could test USD 1,250 and the 50% Fib retracement level of the downward move from the USD 1,375 swing high to the USD 1,124 low.
A close above the USD 1,250 resistance could set the pace for a bigger move towards the USD 1,320 resistance. Further gains could require a test of the $1,350 level in the near term.
Another drop?
If BNB fails to clear the USD 1,200 resistance, it could trigger another decline. The initial downside support is near the $1,125 level. The next major support is near the $1,100 level.
The main support is at $1,065. If there is a downside break below the USD 1,065 support, the price could fall towards the USD 1,000 support. Any further losses could trigger a bigger decline towards the $950 level.
Technical indicators
Hourly MACD – The MACD for BNB/USD is gaining speed in the bearish zone.
Hourly RSI (Relative Strength Index) – The RSI for BNB/USD is currently below the 50 level.
Major support levels – USD 1,120 and USD 1,100.
Major resistance levels – $1,200 and $1,250.