

The BNB price is struggling to rise above Support zone at $550. The price could trigger a fresh rise if it crosses the USD 560 resistance zone.
- BNB price started a new decline from the USD 592 resistance zone.
- The price is now trading below $565 and the 100-hour moving average.
- A connecting bearish trendline is forming with resistance at $560 on the hourly chart of the BNB/USD pair (Binance data source).
- The pair could gain bullish momentum if it breaks the $560-$562 resistance zone.
BNB Price Eyes recovery
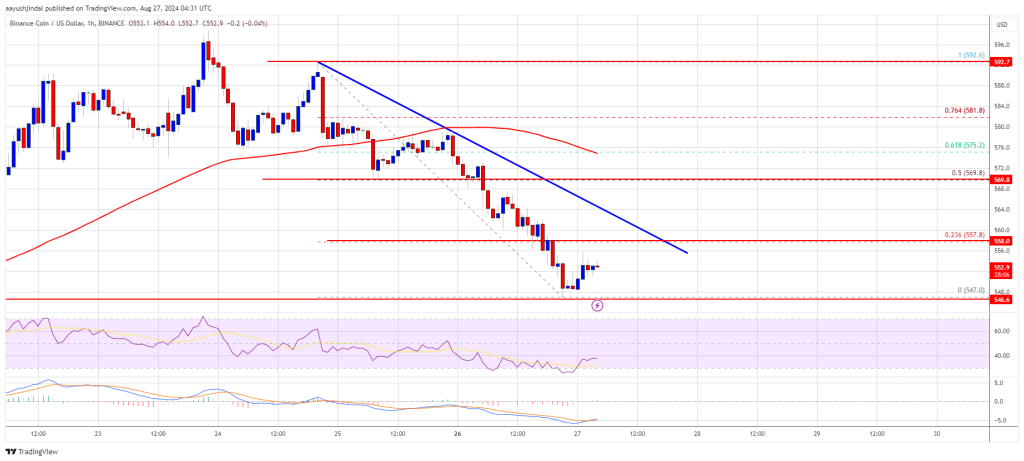
After struggling to test the USD 600 resistance, BNB price started a new decline, just like Ethereum and Bitcoin. The price fell below the USD 585 and USD 572 support levels. There was also a move below $560.
Finally, the price found support at $548. A low was formed at $547 and the price is now consolidating losses. A connecting bearish trendline is also forming with resistance at $560 on the hourly chart of the BNB/USD pair.
The pair is now trading below $565 and the 100-hour moving average. If a recovery wave comes, the price may encounter resistance near the $558 level and the trendline. It is close to the 23.6% Fib retracement level of the downward move from the $592 swing high to the $547 low.
The next resistance is near the $562 level. A clear move above the $562 zone could send the price higher. In the said case, BNB price could test $570 or the 50% Fib retracement level of the downward move from the $592 swing high to the $547 low.
A close above the USD 570 resistance could set the pace for a bigger rise towards the USD 585 resistance. Further gains could require a test of the $592 level in the near term.
More disadvantages?
If BNB fails to clear the USD 560 resistance, it could trigger another decline. The initial downside support is near the USD 550 level. The next major support is near the $548 level.
The main support is at $542. If there is a downside break below the USD 542 support, the price could fall towards the USD 530 support. Any further losses could trigger a bigger decline towards the $515 level.
Technical indicators
Hourly MACD – The MACD for BNB/USD is losing pace in the bearish zone.
Hourly RSI (Relative Strength Index) – The RSI for BNB/USD is currently below the 50 level.
Major support levels – USD 550 and USD 548.
Major resistance levels – $560 and $570.