

BNB price started a steady rise above the USD 550 resistance. The price is now consolidating and could target more gains above $585.
- BNB price started a decent upward move from the USD 500 support zone.
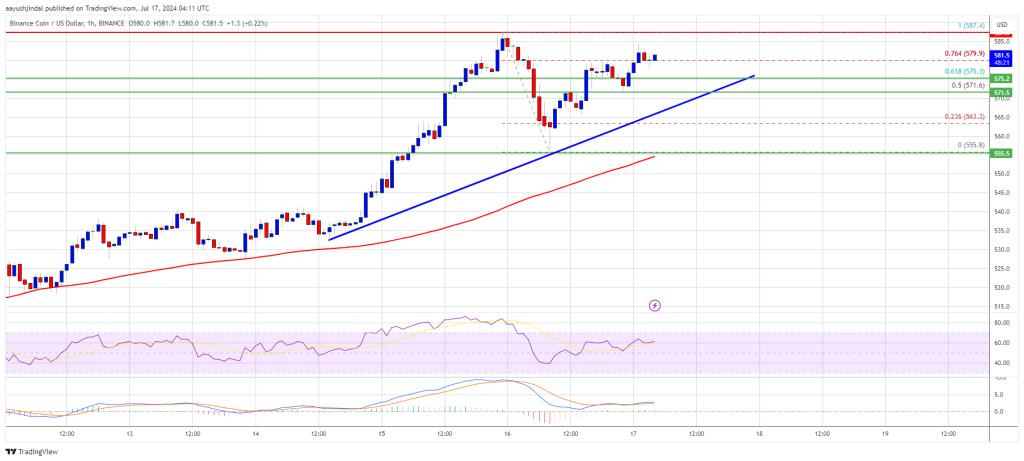
- The price is now trading above $550 and the 100-hour moving average.
- A connecting bullish trendline is forming with support at $572 on the hourly chart of the BNB/USD pair (Binance data source).
- The pair could extend its rise if it can overcome the USD 588 resistance in the near term.
BNB price starts new increase
In recent days, BNB price has seen quite an upward move from the $500 support zone, like Ethereum and Bitcoin. The price was able to climb above the USD 535 and USD 550 resistance levels.
It has even cleared the USD 570 resistance. The current wave surpassed the 61.8% Fib retracement level of the downward correction from the $587 swing high to the $555 low. The price is now trading above $550 and the 100-hour moving average.
It is now consolidating above the 76.4% Fib retracement level of the downward correction from the $587 swing high to the $555 low. A connecting bullish trendline is also forming with support at $572 on the hourly chart of the BNB/USD pair.
On the upside, the price could encounter resistance around the $585 level. The next resistance is near the $588 level. A clear move above the $588 zone could send the price higher. In the said case, BNB price could test $600.
A close above the USD 600 resistance could set the pace for a bigger rise towards the USD 625 resistance. Any further gains could require a test of the $640 level in the coming days.
Are dips supported?
If BNB fails to clear the USD 588 resistance, it could initiate a downward correction. The initial downside support is near the $572 level or the trendline.
The next major support is near the $564 level. The main support is at $550. If there is a downside break below the USD 550 support, the price could fall towards the USD 535 support. Any further losses could trigger a bigger decline towards the $520 level.
Technical indicators
Hourly MACD – The MACD for BNB/USD is gaining speed in the bullish zone.
Hourly RSI (Relative Strength Index) – The RSI for BNB/USD is currently above the 50 level.
Major support levels – USD 572 and USD 564.
Major resistance levels – $588 and $600.