

The BNB price is recovering higher from the Support zone at $500. The price is now showing positive signs and could aim for more gains above $535.
- BNB price started a recovery wave from the USD 500 support zone.
- The price is now trading above $515 and the 100-hour moving average.
- A major ascending channel is forming with resistance at $528 on the hourly chart of the BNB/USD pair (Binance data source).
- The pair could gain bullish momentum if it breaks the $535-$538 resistance zone.
BNB Price has more positive aspects
After forming a base above the $500 level, BNB price started a decent upward move, much like Ethereum and Bitcoin. The price broke the USD 510 and USD 515 resistance levels and entered a short-term bullish zone.
The price surpassed the 50% Fib retracement level of the downward move from the $5376 swing high to the $499 low. It has even cleared the USD 520 resistance. The price is now trading above $515 and the 100-hour moving average.
It is now consolidating near the 61% Fib retracement level of the downward move from the $5376 swing high to the $499 low. On the upside, the price could encounter resistance around the $528 level. A key ascending channel is also forming with resistance at $528 on the hourly chart of the BNB/USD pair.
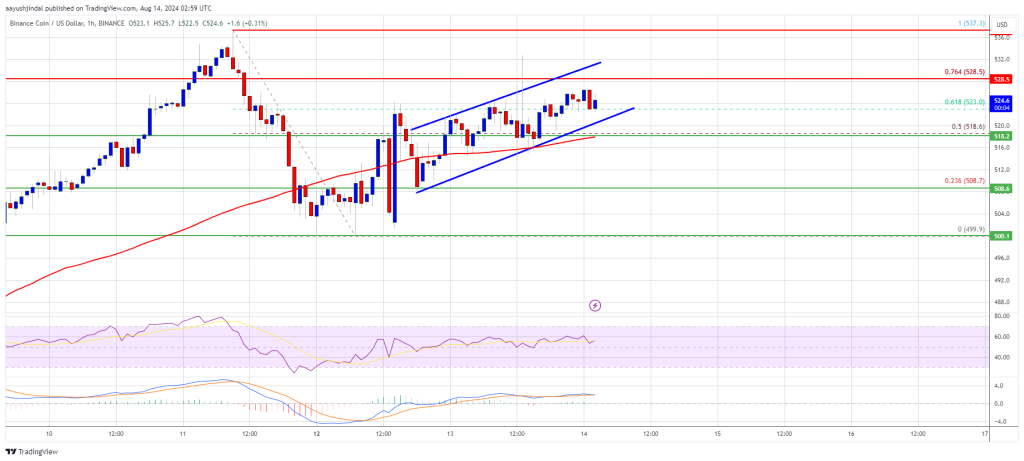
The next resistance is near the $535 level. A clear move above the $535 zone could send the price higher. In the said case, BNB price could test $550. A close above the USD 550 resistance could set the pace for a bigger rise towards the USD 565 resistance. Further gains could require a test of the $580 level in the near term.
Another drop?
If BNB fails to clear the USD 535 resistance, it could trigger another decline. The initial downside support is near the $520 level. The next major support is near the $518 level.
The main support is at $508. If there is a downside break below the USD 508 support, the price could fall towards the USD 500 support. Any further losses could trigger a bigger decline towards the $480 level.
Technical indicators
Hourly MACD – The MACD for BNB/USD is gaining speed in the bullish zone.
Hourly RSI (Relative Strength Index) – The RSI for BNB/USD is currently above the 50 level.
Major support levels – USD 518 and USD 508.
Major resistance levels – $528 and $535.