

- BNB has tested the resistance at $599.9 but is at risk of a double top formation.
- Momentum indicators point to a potential breakout above $600.
Binance coin [BNB] waIt shows resilience as it neared a critical level, trading at $597.2 with a marginal decline of 0.08% at the time of writing.
The key question for traders and investors is whether BNB can decisively break the USD 600 resistance and ignite a stronger rally.
Let’s analyze the current price action, key technical levels and momentum indicators to understand if this breakout is possible.
BNB current price structure: are we going higher?
BNB has been trading within a bandwidth-bound structure for several weeks, with the price fluctuating between $560 and $600. This follows a consistent uptrend from the August low around $500, reflecting increasing buying pressure.
However, BNB has repeatedly faced rejections around the $599.9 level. Nevertheless, there is growing optimism that BNB could break above this key resistance, potentially opening the door for a rally towards the June $715.7 level.
Key resistance and support levels to watch
The $599.9 level remains the critical resistance and acts as a strong barrier to further upside momentum. Should BNB break this level with a strong close above $600, a rise towards $715.7 could follow.
Conversely, the $560 support level remains intact for now, providing a safety net should the price pull back. Failure to sustain USD 560 could lead to a deeper decline towards USD 500.
A potential bearish signal to consider is the double top formation around the resistance at $599.9. This pattern could indicate a trend reversal, and if BNB fails to break higher, it could trigger a corrective move.
However, a strong breakout above $600 would invalidate this formation, creating a potential bullish extension.
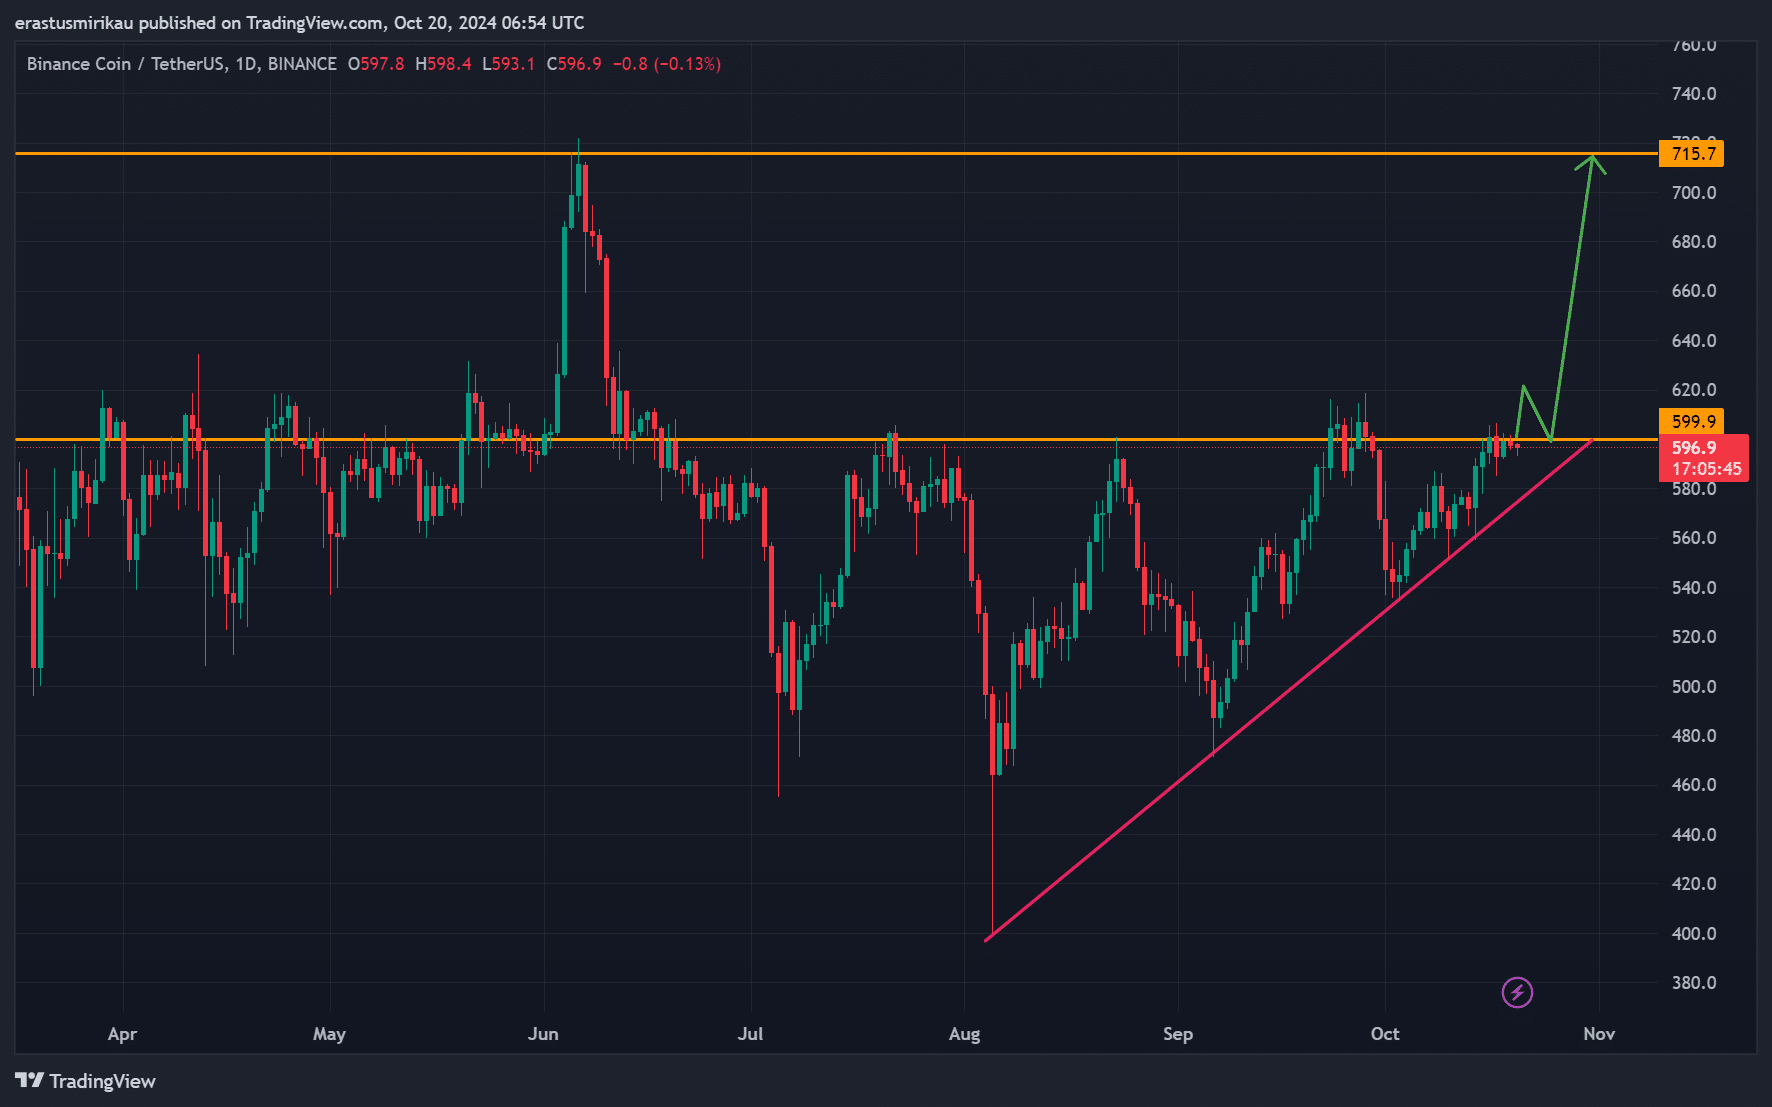
Source: TradingView
BNB technical indicators: RSI and MACD in focus
The Relative Strength Index (RSI) currently stands at 56, indicating neutral momentum with room for further upside.
Meanwhile, the MACD provided a bullish crossover as it was above the signal line at the time of writing.
Therefore, both indicators suggested that upward momentum was building, increasing the likelihood of a potential breakout.
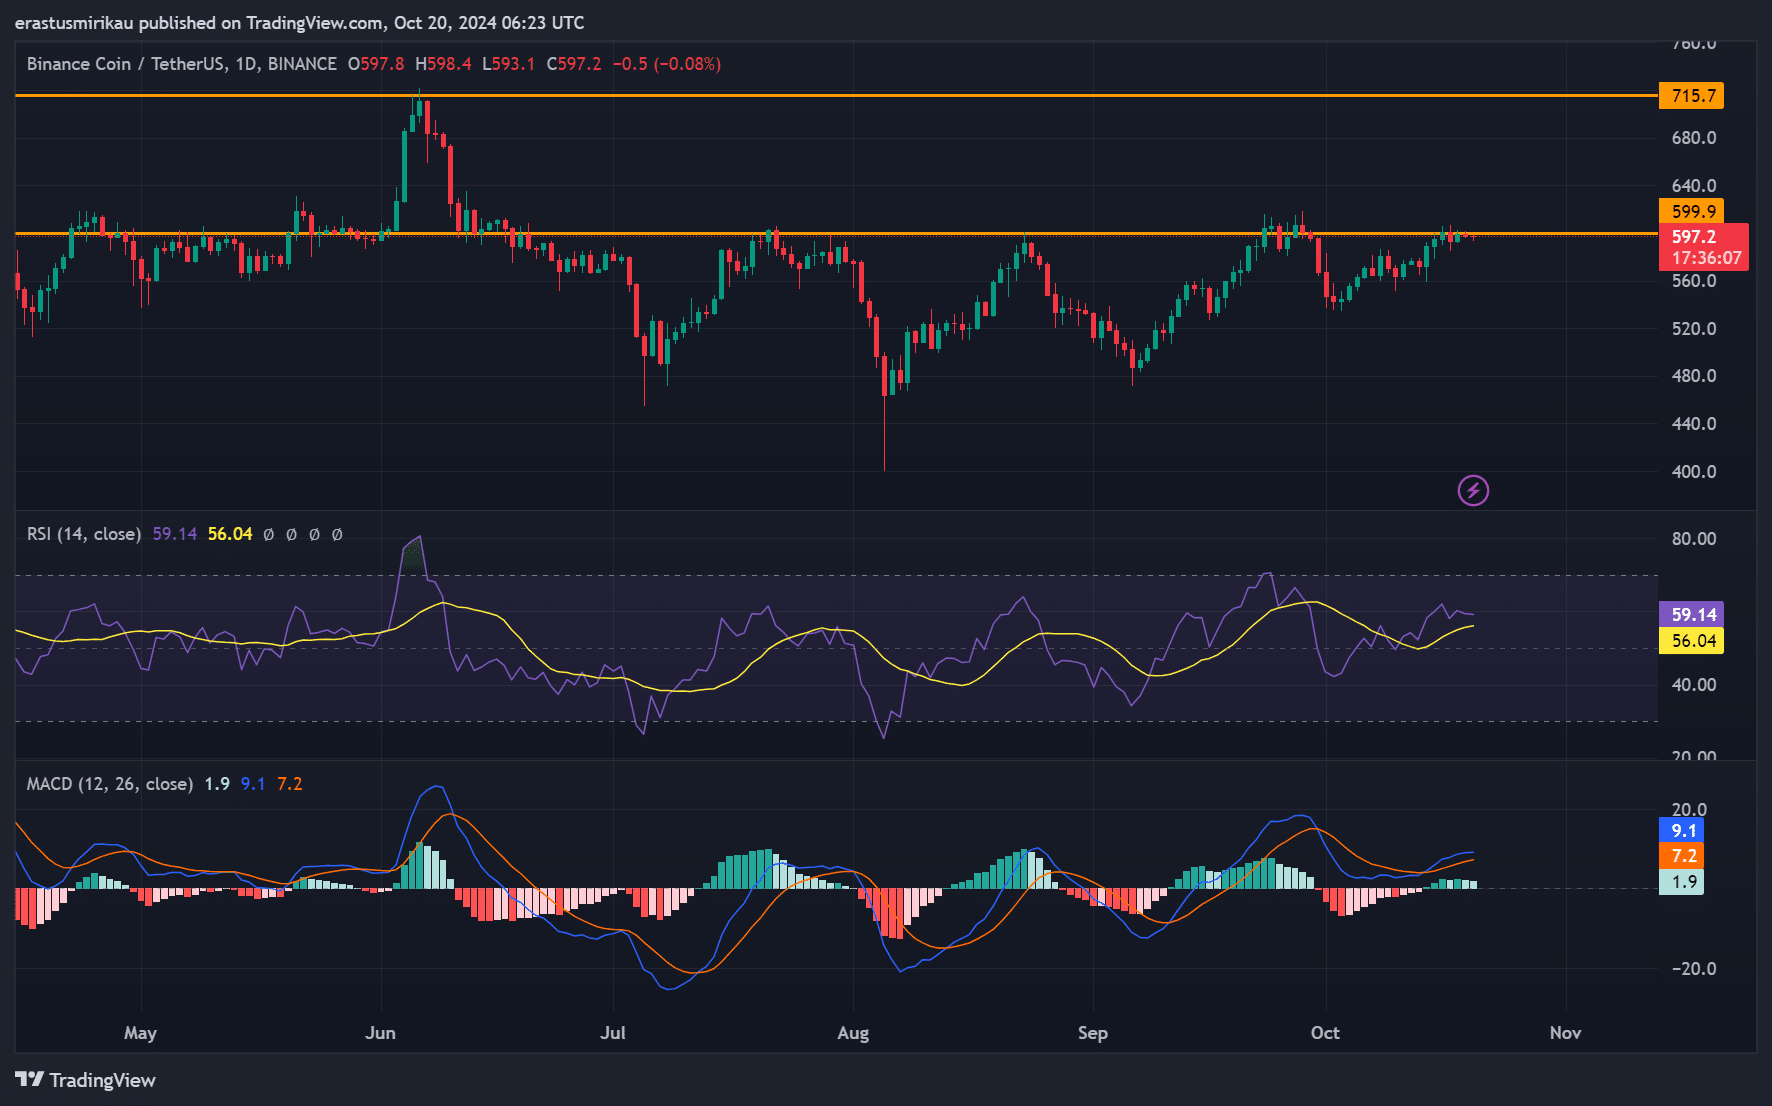
Source: TradingView
BNB’s social dominance: a bullish sign?
Furthermore, BNB’s social dominance rose to 0.92% at the time of writing. This increase in attention could further stimulate purchasing interest.
Historically, greater social dominance has often led to greater price volatility and, consequently, stronger price movements.
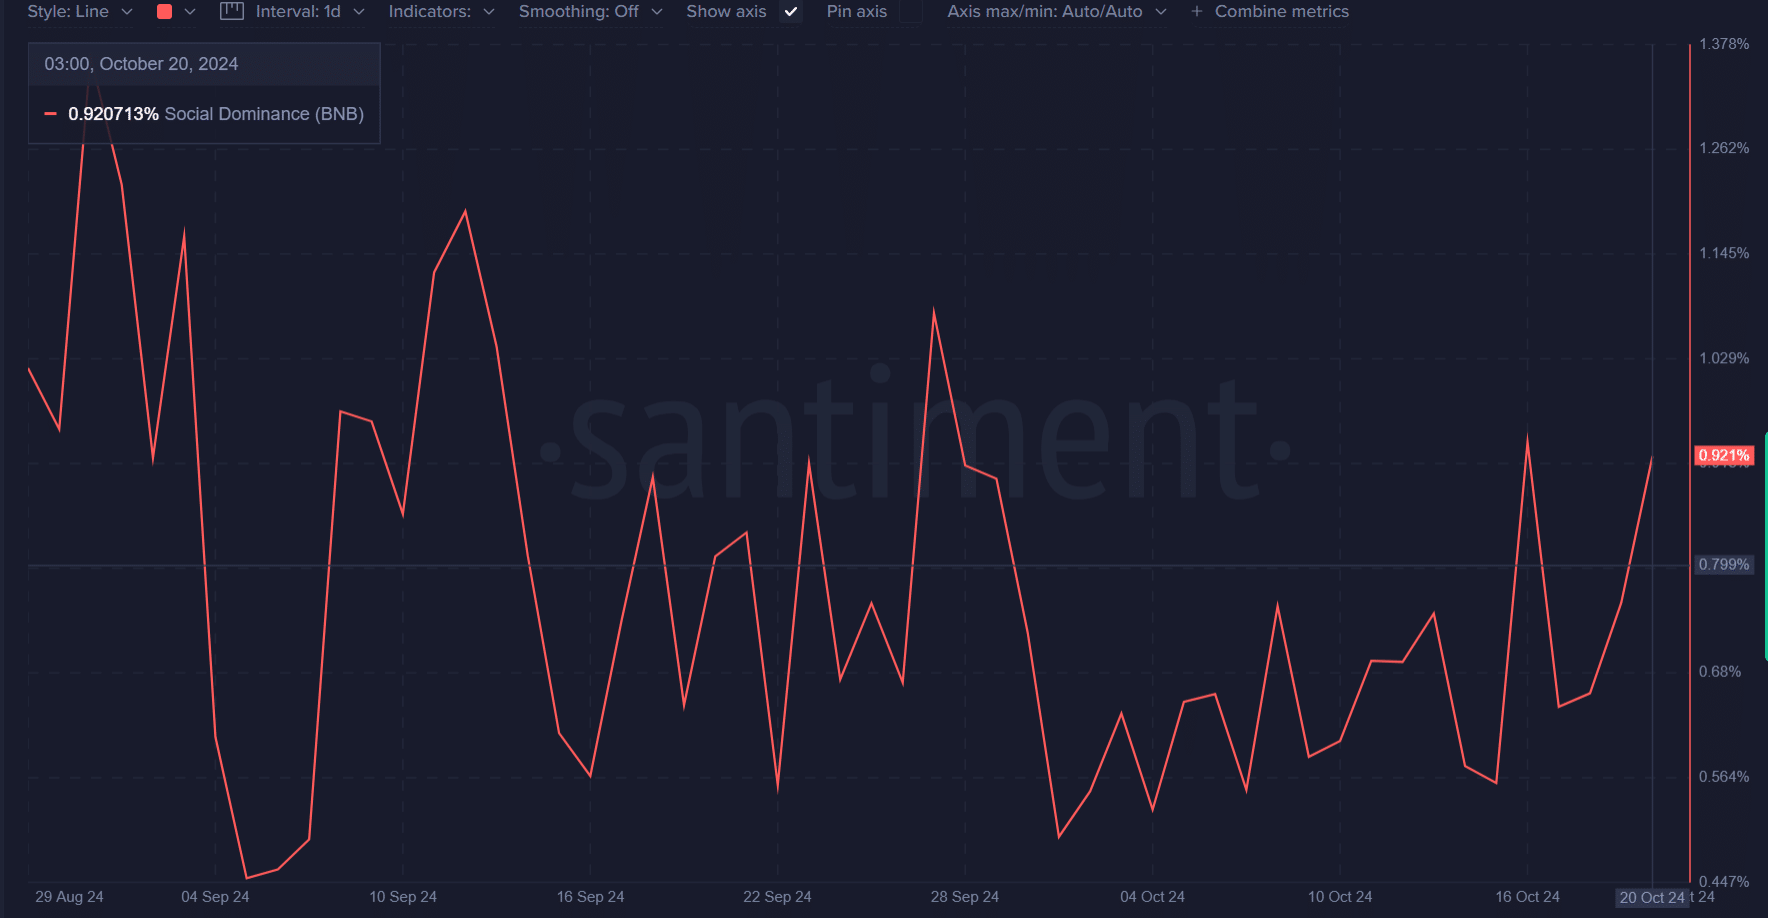
Source: Santiment
Read Binance Coin’s [BNB] Price forecast 2024–2025
Is an outbreak coming?
BNB is at a crucial moment. While resistance at $599.9 remains a formidable hurdle, bullish technical indicators and rising social interest suggest a breakout is in the offing.
If BNB can close above $600, the next target would likely be $715.7. Therefore, traders should keep a close eye on the price action in the coming days for a decisive move.