

Bitcoin price extended losses and traded below $88,500. BTC is consolidating losses and could attempt a recovery wave if it clears $88,500.
- Bitcoin started a small recovery wave from the $86,000 level.
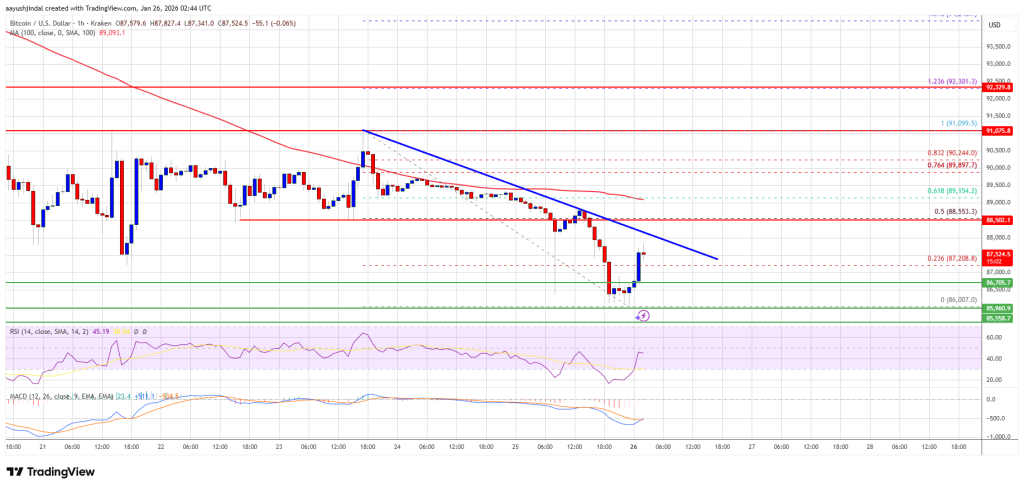
- The price is trading below $88,200 and the 100 hourly Simple Moving Average.
- A new bearish trendline is forming with resistance at $88,000 on the hourly chart of the BTC/USD pair (data feed from Kraken).
- The pair could recover if it manages to settle above USD 86,200 and USD 86,000.
Bitcoin price continues to fall
Bitcoin price failed to hold above the $89,000 support and extended losses. BTC fell sharply below the USD 88,500 and USD 87,000 support levels.
The bears even pushed the price below $86,500. A low was formed at $86,007, and the price is now trying to make a recovery wave. There was a move above the 23.6% Fib retracement level of the downward move from the $91,099 swing high to the $86,007 low.
Bitcoin is now trading below $88,500 and the 100 hourly Simple Moving Average. If the price remains stable above USD 86,500, a new increase can be attempted. The immediate resistance is near the $88,000 level. A new bearish trendline is also forming with resistance at $88,000 on the hourly chart of the BTC/USD pair.
The first major resistance is near the $88,500 level as it is close to the 50% Fib retracement level of the downward move from the $91,099 swing high to the $86,007 low.
A close above the resistance at $88,500 could send the price higher. In the mentioned case, the price could rise and test the USD 89,200 resistance. Any further gains could send the price towards the $90,000 level. The next barrier for the bulls could be $91,000 and $91,500.
Lose more in BTC?
If Bitcoin fails to rise above the USD 88,500 resistance zone, it could trigger another decline. Immediate support is near the $86,700 level. The first major support is near the $86,200 level.
The next support is now near the $85,500 zone. Any further losses could send the price towards the USD 83,500 support in the short term. The key support is at $82,500, below which BTC struggles to recover in the short term.
Technical indicators:
Hourly MACD – The MACD is now losing pace in the bearish zone.
Hourly RSI (Relative Strength Index) – The RSI for BTC/USD is now below the 50 level.
Major support levels – $86,700, followed by $86,000.
Major resistance levels – $88,500 and $89,200.