

- Bitcoin has not had the momentum to break the key resistance levels in recent months.
- The waning bullish momentum was clearly visible in the Bitcoin NVT Golden Cross metric.
Bitcoin [BTC] was in a difficult position at the time of writing.
Spot ETF inflows have been negative and the recent sharp price drop caused major liquidations. The massive outflow of BTC from Binance did not boost market sentiment either.
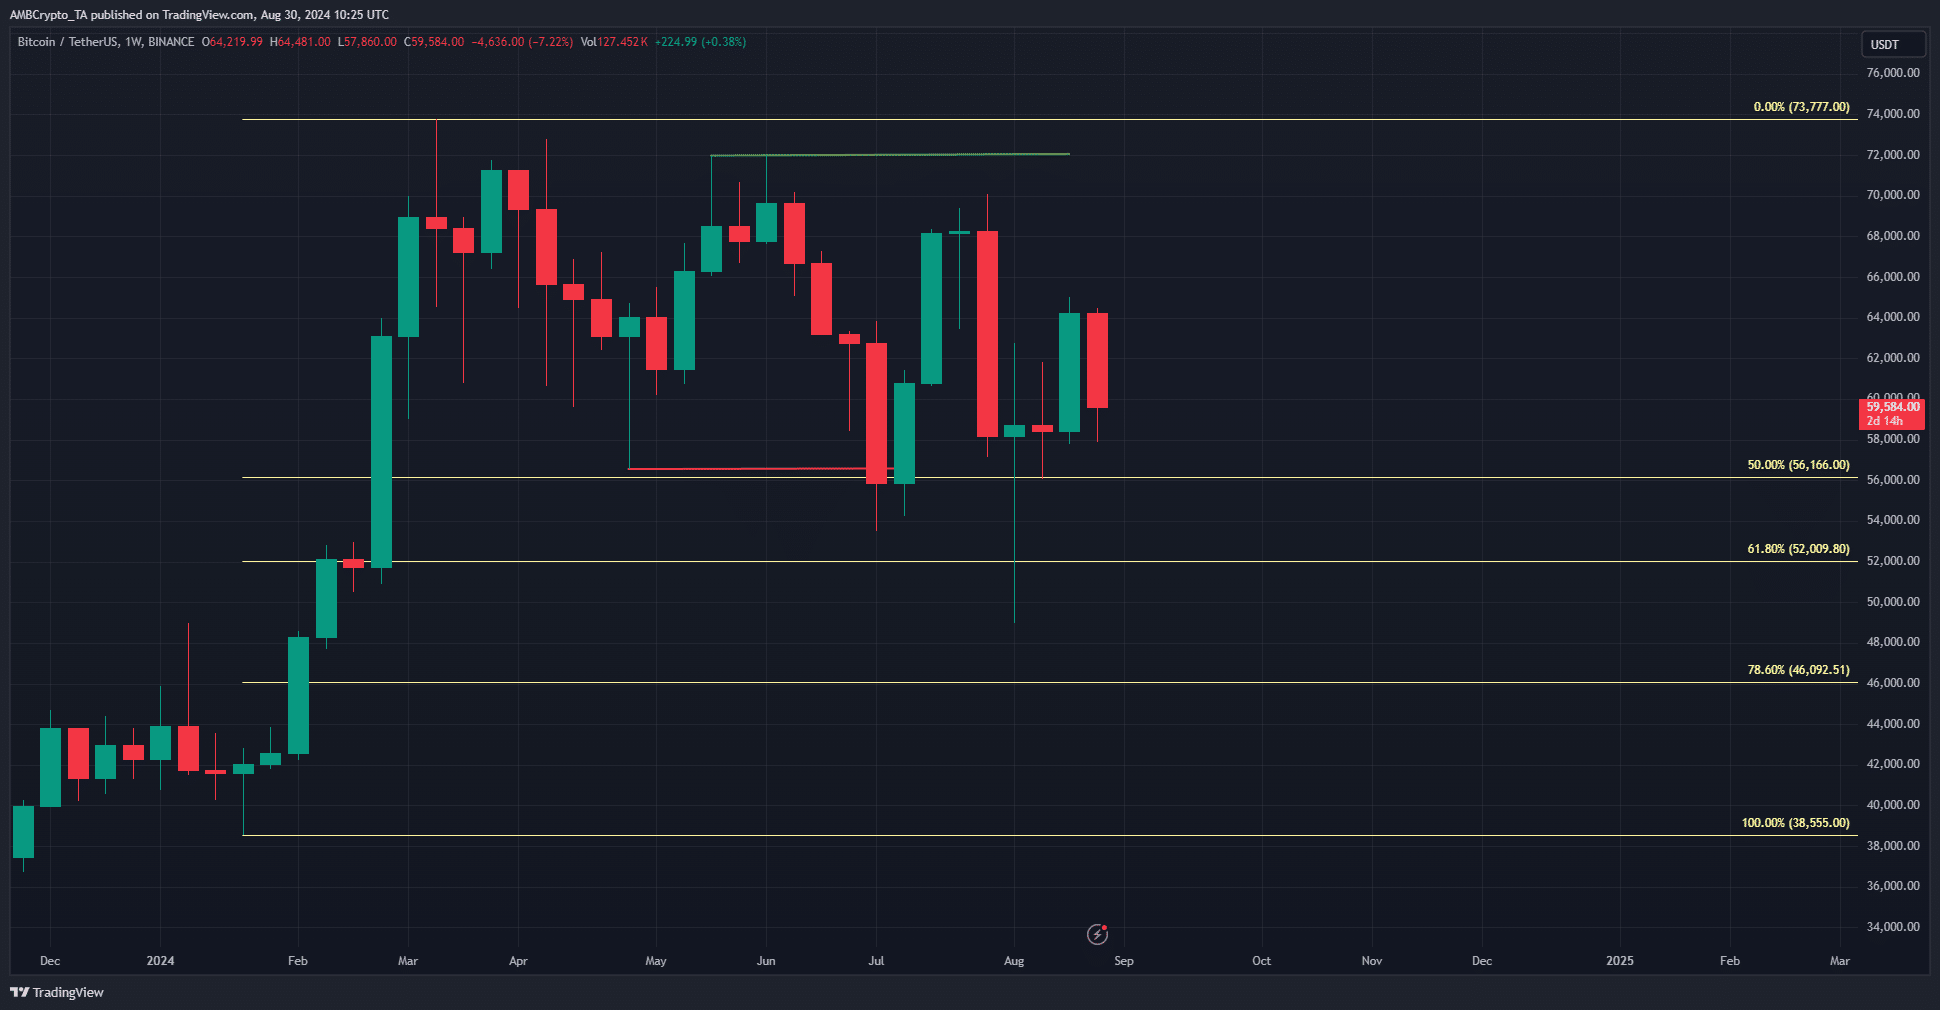
Source: BTC/USDT on TradingView
On the weekly chart, the market structure remained bearish. No new highs were made and the king of crypto formed a series of lower highs since April. Should Traders Anticipate More Weakness?
The Bitcoin Golden Cross trend
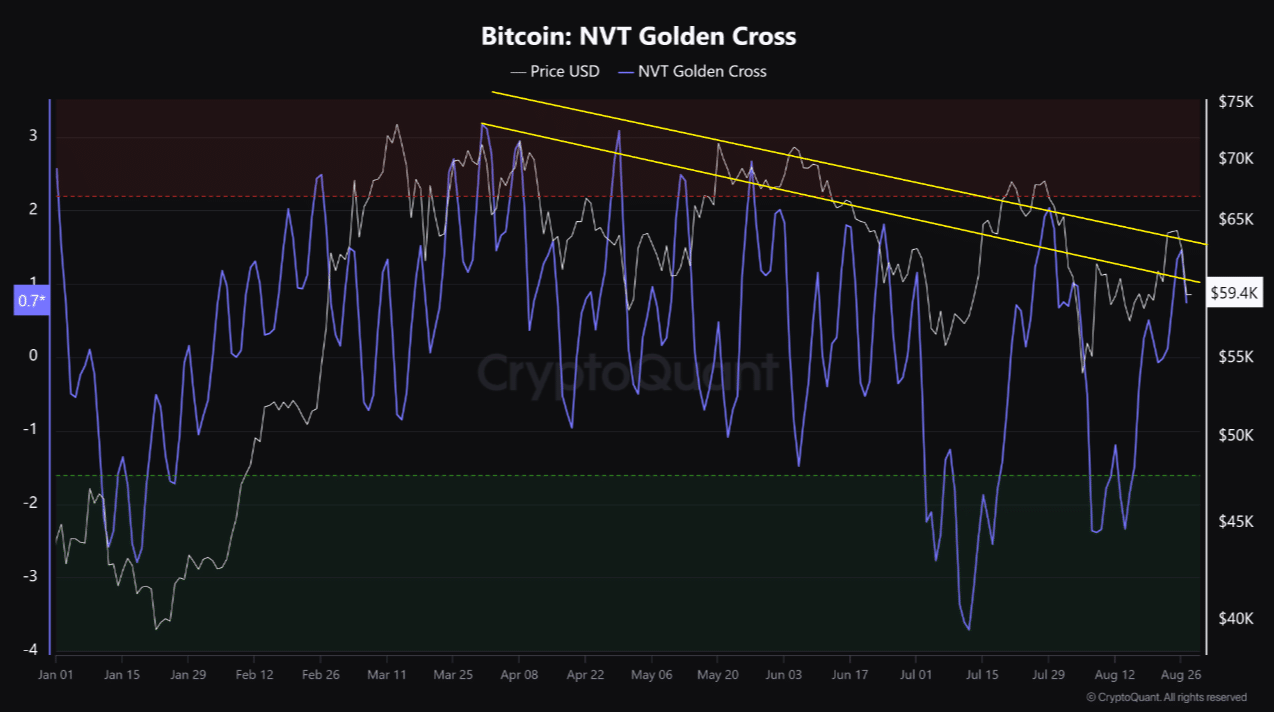
In one post on CryptoQuantcrypto analyst Burrak Kesmeci noted that the Bitcoin NVT Golden Cross highs have been in a downtrend for the past six months.
The values of the peaks decreased from 3.17 on March 31 to 1.46 on August 26.
The Network Value to Transactions (NVT) Golden Cross metric compares the short-term and long-term trend of the NVT metric, providing a Bollinger Bands-like signal indicator.
Values above 2.2 indicate that the network is likely overpriced, while values below -1.6 indicate a market bottom.
The drop from peak values since late March is a sign that Bitcoin may be undervalued relative to transaction volume and presents an accumulation opportunity.
It also highlighted the bulls’ inability to force a break past key resistance levels such as USD 70,000.
On-chain data supports the bullish side
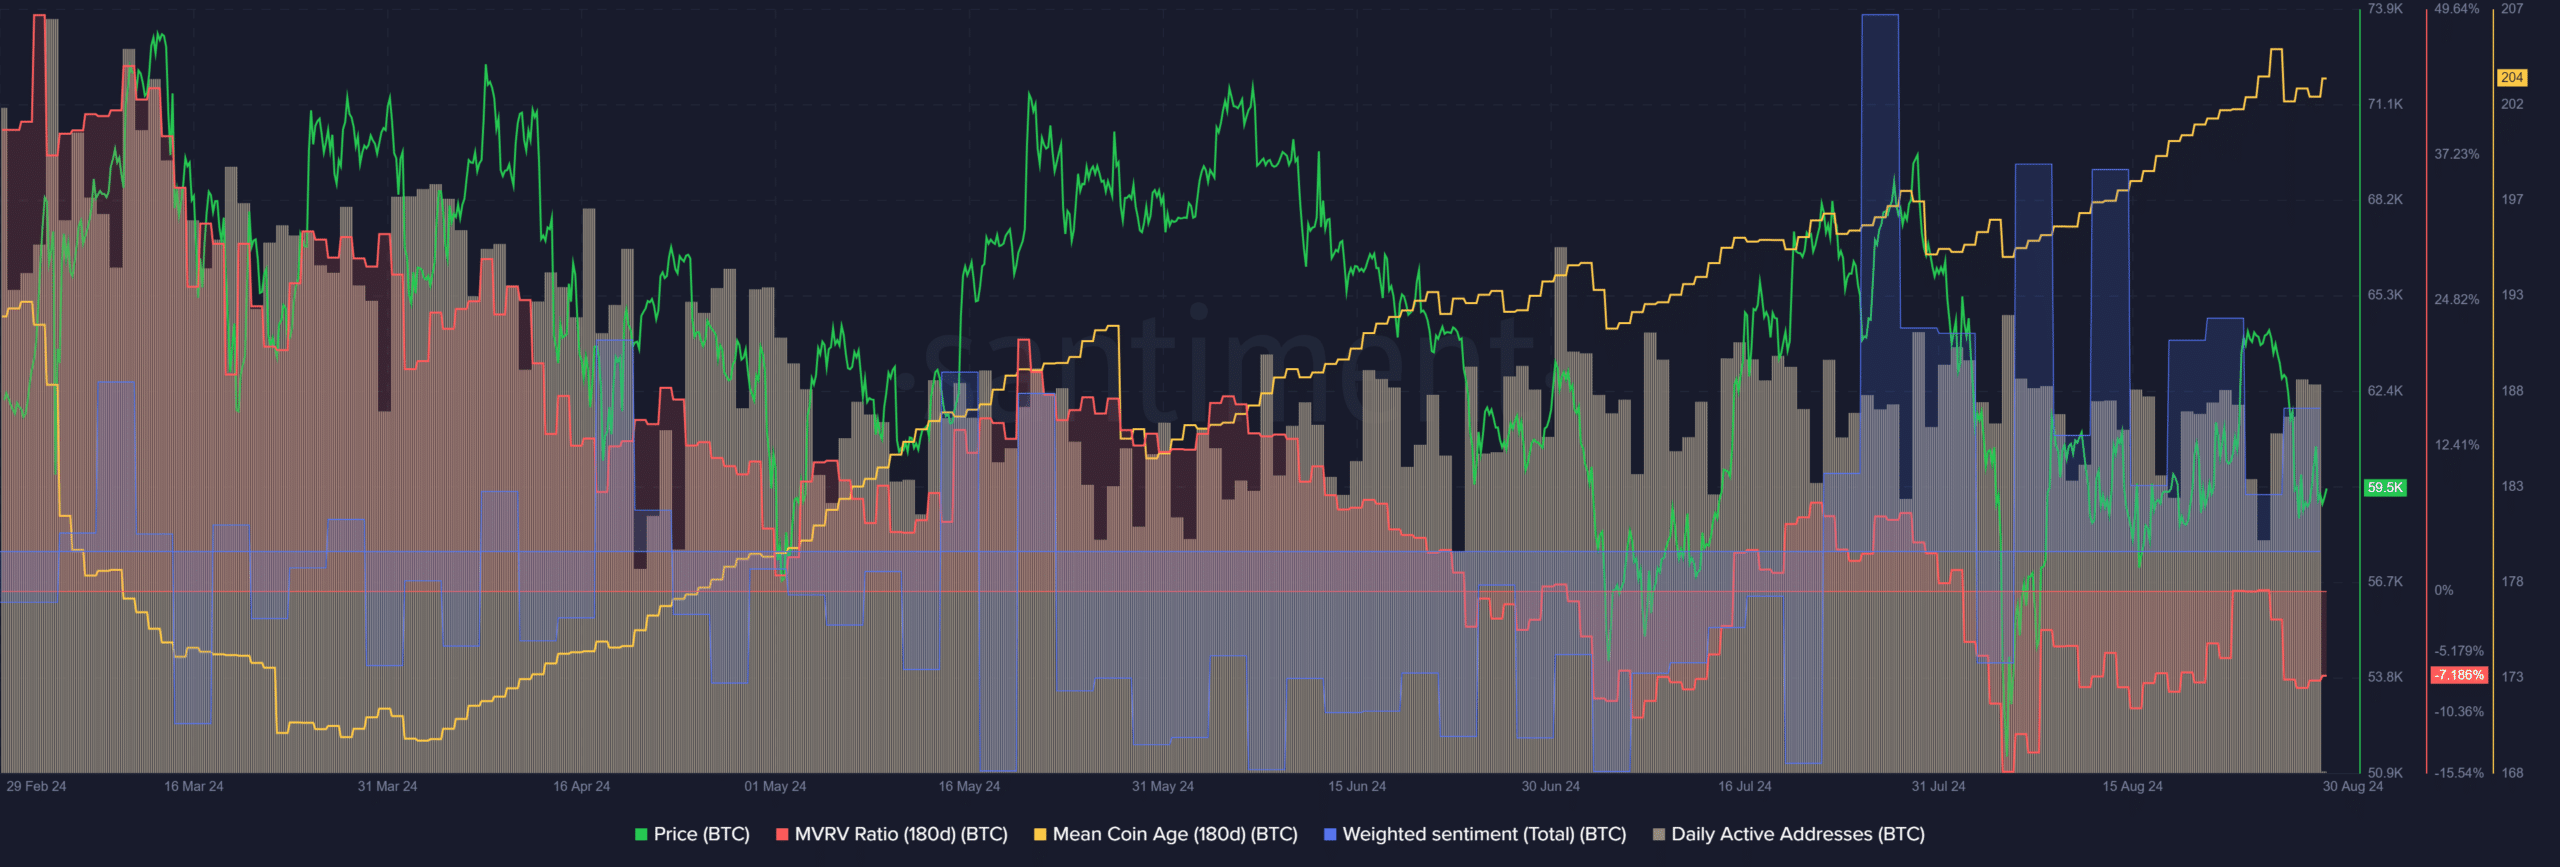
The 180-day average coin age has continued to rise since late March, even as the weekly market structure turned bearish in recent months.
Read Bitcoin’s [BTC] Price forecast 2024-25
There was also strong positive engagement on social media last month, even though Bitcoin’s price development was choppy.
The MVRV was negative to indicate that the holders were making a loss and that the asset was likely undervalued. Meanwhile, the daily active addresses statistic has been stable since June.